
PUBLISHER: Mordor Intelligence | PRODUCT CODE: 1911495

PUBLISHER: Mordor Intelligence | PRODUCT CODE: 1911495
Hard Disk Drive (HDD) - Market Share Analysis, Industry Trends & Statistics, Growth Forecasts (2026 - 2031)
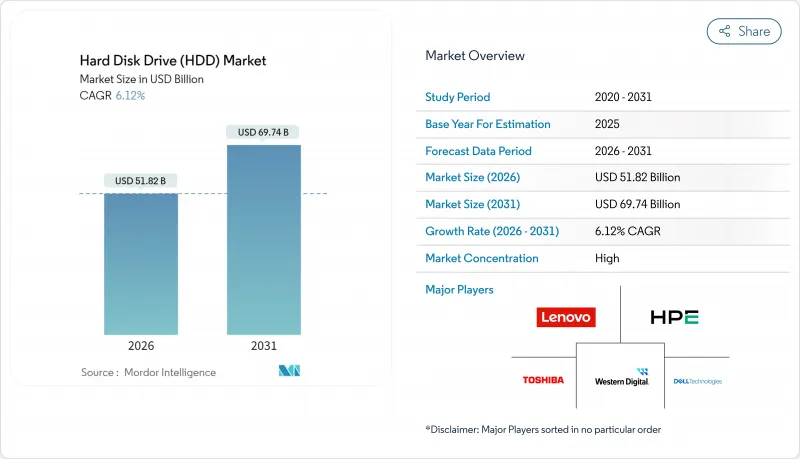
Hard Disk Drive market size in 2026 is estimated at USD 51.82 billion, growing from 2025 value of USD 48.83 billion with 2031 projections showing USD 69.74 billion, growing at 6.12% CAGR over 2026-2031.
Cost-per-terabyte advantages, HAMR-driven capacity roadmaps that point to 100 TB and beyond, and the explosion of AI-generated cold data keep hard drives central to hyperscale storage strategies. Near-line enterprise deployments expand as cloud providers allocate roughly 15-20% of their record USD 315 billion 2025 capital budgets to storage infrastructure, while energy-per-terabyte metrics sustain demand in power-constrained data-center markets. Interface trends reveal SATA's broad installed base, yet SAS and emerging NVMe pathways gain momentum where higher bandwidth is essential. Supply dynamics remain delicate because three suppliers control nearly all output; any disruption, from trade friction to natural disasters, propagates quickly through the Hard Disk Drive market [WESTERN DIGITAL.COM]. At the same time, regional manufacturing incentives in Asia-Pacific and North America are rewriting production footprints and favoring near-shoring of final assembly for mission-critical enterprise orders.
Global Hard Disk Drive (HDD) Market Trends and Insights
Rising Demand for Hyperscale and Cloud Storage Capacity
Hyperscale data-center count reached 1,136 at year-end 2024 and is projected to triple by 2030 as AI accelerators reshape computing footprints. Storage represents roughly one-fifth of the 2025 capex plans of major cloud operators, channeling billions into very-large-capacity racks that favor the Hard Disk Drive market for cold-tier deployments. Exabyte shipments of HDDs are forecast by Western Digital to grow at 23% between 2024 and 2028, driven primarily by HAMR-enabled density gains. The United States holds 54% of installed hyperscale capacity, yet local power constraints reward drives that deliver superior watts-per-terabyte performance. Disaggregated architectures now separate compute from storage, letting HDDs handle vast cold data pools while SSDs manage hot data access.
Cost/TB Advantage Over SSDs in Near-line Workloads
Seagate reported achieving USD 15 per terabyte across 398 exabytes shipped in fiscal 2024, preserving an estimated 2.5X cost gap against enterprise SSDs. At 30 TB capacity points, the price delta widens to roughly 3-4X, reinforcing the Hard Disk Drive market in cost-sensitive cold-data tiers. Flash manufacturers continue lowering dollars-per-terabyte through 3D NAND scaling, yet endurance and write-cost constraints keep total-cost-of-ownership favorable to drives for sequential-heavy workloads. Enterprise buyers increasingly articulate hybrid strategies that blend high-performance SSD tiers with large pools of HDD capacity to optimize spend and service-level objectives.
Rapid SSD $/TB Declines and Enterprise Flash TCO Gains
Flash vendors now produce 232-layer 3D NAND, pushing bit costs lower each quarter. Pure Storage's design wins at hyperscalers highlight scenarios where flash achieves compelling total cost when energy, cooling, and floor space savings are lumped into the equation. The arrival of 61.44 TB enterprise SSDs signals capacity convergence, albeit at a premium price. QLC NAND promises further dollar-per-bit gains, yet endurance constraints confine such products to read-heavy workloads. As corporate buyers increasingly adopt a holistic procurement lens, HDDs must continue to elevate capacity faster than flash narrows its cost gap.
Other drivers and restraints analyzed in the detailed report include:
- Growth of Video-Surveillance Data for Smart-City Roll-outs
- AI-Driven Cold-Data Tiering Adoption
- Extreme Supplier Concentration and Supply-Chain Shocks
For complete list of drivers and restraints, kindly check the Table Of Contents.
Segment Analysis
3.5-inch units delivered 65.62% revenue in 2025, outpacing the overall Hard Disk Drive market with a 9.29% CAGR to 2031. Their large platters enable superior gigabytes-per-rack metrics, critical for hyperscale operators that price floor space in thousands of dollars per square foot. The Hard Disk Drive market size for 3.5-inch products is projected to eclipse USD 45.2 billion by 2031. HAMR and UltraSMR advances let vendors roadmap 40 TB on the same envelope, reinforcing the segment's scale economics.
Smaller 2.5-inch drives cater to notebooks and compact servers but face SSD substitution, limiting growth prospects. Sub-1.8-inch form factors occupy niche consumer electronics and industrial gear. High-density JBOD chassis relying on 3.5-inch platforms retain cost leadership in cold-tier architectures because fewer spindles meet exabyte targets. Seagate's recent Japan launch of 20 TB and 24 TB BarraCuda SKUs at consumer-friendly pricing underscores continued investment in the high-capacity 3.5-inch roadmap.
Near-line enterprise environments garnered 44.10% of 2025 shipments and will grow at a 9.52% CAGR, the fastest among major workloads. Cloud architects funnel expanding AI training sets onto low-cost, high-density tiers, keeping the Hard Disk Drive market central to petabyte-scale clusters. The Hard Disk Drive market share for near-line roles benefits from the cold-data swell forecast by McKinsey, which aligns with drives' sequential write and economical retention strengths.
Consumer desktop and gaming PCs move steadily to SSD, trimming unit demand for entry drives below 1 TB. Surveillance arrays and NAS devices remain resilient because write patterns and capacity needs suit magnetic media. Enterprise data-center teams continue adopting disaggregated models where SSD and HDD coexist, but the near-line layer commands the highest absolute exabyte growth through the decade.
The Hard Disk Drive Market Report is Segmented by Form Factor (2. 5-Inch, 3. 5-Inch, Others), Application (Mobile/Portable, Consumer Desktop and Gaming, and More), Storage Capacity (<1TB, 1-3TB, 3-5TB, >5TB), Interface (SATA, SAS, PCIe/NVMe), End-User Industry (IT and Telecommunications, and More), Recording Technology (CMR/PMR, SMR, HAMR and Energy-Assisted), and Geography. The Market Forecasts are Provided in Terms of Value (USD).
Geography Analysis
Asia-Pacific commanded 36.10% of global revenue in 2025 and is growing at a 6.84% CAGR through 2031. China and Japan anchor regional demand through hyperscale build-outs and domestic OEM shipments, while Thailand continues as a manufacturing hub with Western Digital's USD 693 million expansion approved in August 2024. India's retail drive volumes expanded 12% quarter-over-quarter in Q2 2024 as e-commerce and home-office trends persisted. Smart-city budgets across Southeast Asia, including Malaysia's USD 17 billion data-center and surveillance programs, intensify regional exabyte uptake.
North America is the second-largest territory, propelled by U.S. hyperscale operators that hold 54% of installed cloud capacity. Trade-policy headwinds inject cost uncertainty, though proposed incentives encourage domestic assembly that could shorten supply chains. Growing power-grid constraints around Virginia's data-center corridor steer architects toward watts-per-terabyte efficiencies that favor the Hard Disk Drive market versus all-flash arrays. Canada and Mexico play supportive roles by providing land, renewable electricity, and cross-border logistics advantages.
Europe maintains consistent enterprise replacement cycles amid stringent data-sovereignty mandates. Germany and the United Kingdom deploy cold-tier clusters to meet compliance retention windows, while France expands public-sector cloud workloads. The region's circular-economy focus dovetails with vendor recycling programs, such as Western Digital's recovery of rare-earth elements from 50,000 pounds of retired drives in 2024. Long-term carbon tax discussions may influence recording-technology choices as HDD makers showcase lower lifecycle CO2 than competing storage media.
- Western Digital Corporation
- Toshiba Electronic Devices & Storage Corporation
- Hewlett Packard Enterprise Company
- Dell Technologies Inc.
- Lenovo Group Limited
- Huawei Technologies Co., Ltd.
- Transcend Information Inc.
- ADATA Technology Co., Ltd.
- Buffalo Inc.
- Nidec Corporation
- Showa Denko K.K.
- Hoya Corporation
- NetApp Inc.
- Pure Storage Inc.
- Samsung Electronics Co., Ltd. (external HDD brand)
- Micron Technology Inc. (external storage systems)
- Violin Systems LLC
- Synology Inc.
- QNAP Systems Inc.
- LaCie S.A.S. (Seagate brand)
Additional Benefits:
- The market estimate (ME) sheet in Excel format
- 3 months of analyst support
TABLE OF CONTENTS
1 INTRODUCTION
- 1.1 Study Assumptions and Market Definition
- 1.2 Scope of the Study
2 RESEARCH METHODOLOGY
3 EXECUTIVE SUMMARY
4 MARKET LANDSCAPE
- 4.1 Market Overview
- 4.2 Market Drivers
- 4.2.1 Rising demand for hyperscale and cloud storage capacity
- 4.2.2 Cost/TB advantage over SSDs in near-line workloads
- 4.2.3 Growth of video-surveillance data for smart-city roll-outs
- 4.2.4 AI-driven cold-data tiering adoption
- 4.2.5 Large-capacity HAMR roadmap up to 50 TB drives
- 4.2.6 Circular-economy recycling programs lowering BOM costs
- 4.3 Market Restraints
- 4.3.1 Rapid SSD $/TB declines and enterprise flash TCO gains
- 4.3.2 Extreme supplier concentration and supply-chain shocks
- 4.3.3 Prospective carbon taxes on energy-intensive HDD output
- 4.3.4 Rack-density limits favouring flash-based architectures
- 4.4 Value / Supply-Chain Analysis
- 4.5 Regulatory Landscape
- 4.6 Technological Outlook
- 4.7 Porter's Five Forces Analysis
- 4.7.1 Threat of New Entrants
- 4.7.2 Bargaining Power of Buyers
- 4.7.3 Bargaining Power of Suppliers
- 4.7.4 Threat of Substitutes
- 4.7.5 Intensity of Competitive Rivalry
- 4.8 Macroeconomic Impact Assessment
5 MARKET SIZE AND GROWTH FORECASTS (VALUE)
- 5.1 By Form Factor
- 5.1.1 2.5-inch
- 5.1.2 3.5-inch
- 5.1.3 Others (<1.8-inch, Enterprise JBOD)
- 5.2 By Application
- 5.2.1 Mobile/Portable
- 5.2.2 Consumer Desktop and Gaming
- 5.2.3 NAS and SOHO
- 5.2.4 Enterprise and Data-Center
- 5.2.5 Near-line / Cold-Data
- 5.2.6 Surveillance and Smart-City
- 5.3 By Storage Capacity
- 5.3.1 <1 TB
- 5.3.2 1 - 3 TB
- 5.3.3 3 - 5 TB
- 5.3.4 >5 TB
- 5.4 By Interface
- 5.4.1 SATA
- 5.4.2 SAS
- 5.4.3 PCIe / NVMe (U.2, U.3)
- 5.5 By End-User Industry
- 5.5.1 IT and Telecommunications
- 5.5.2 Consumer Electronics OEMs
- 5.5.3 Cloud and Hyperscale Providers
- 5.5.4 Industrial and Video-Surveillance
- 5.5.5 Government and Defence
- 5.6 By Recording Technology
- 5.6.1 CMR / PMR
- 5.6.2 SMR
- 5.6.3 HAMR and Energy-Assisted
- 5.7 By Geography
- 5.7.1 North America
- 5.7.1.1 United States
- 5.7.1.2 Canada
- 5.7.1.3 Mexico
- 5.7.2 Europe
- 5.7.2.1 Germany
- 5.7.2.2 United Kingdom
- 5.7.2.3 France
- 5.7.2.4 Russia
- 5.7.2.5 Rest of Europe
- 5.7.3 Asia-Pacific
- 5.7.3.1 China
- 5.7.3.2 Japan
- 5.7.3.3 India
- 5.7.3.4 South Korea
- 5.7.3.5 Australia
- 5.7.3.6 Rest of Asia-Pacific
- 5.7.4 Middle East and Africa
- 5.7.4.1 Middle East
- 5.7.4.1.1 Saudi Arabia
- 5.7.4.1.2 United Arab Emirates
- 5.7.4.1.3 Rest of Middle East
- 5.7.4.2 Africa
- 5.7.4.2.1 South Africa
- 5.7.4.2.2 Egypt
- 5.7.4.2.3 Rest of Africa
- 5.7.4.1 Middle East
- 5.7.5 South America
- 5.7.5.1 Brazil
- 5.7.5.2 Argentina
- 5.7.5.3 Rest of South America
- 5.7.1 North America
6 COMPETITIVE LANDSCAPE
- 6.1 Market Concentration
- 6.2 Strategic Moves
- 6.3 Market Share Analysis
- 6.4 Company Profiles (includes Global level Overview, Market level overview, Core Segments, Financials as available, Strategic Information, Market Rank/Share, Products and Services, Recent Developments)
- 6.4.1 Western Digital Corporation
- 6.4.2 Toshiba Electronic Devices & Storage Corporation
- 6.4.3 Hewlett Packard Enterprise Company
- 6.4.4 Dell Technologies Inc.
- 6.4.5 Lenovo Group Limited
- 6.4.6 Huawei Technologies Co., Ltd.
- 6.4.7 Transcend Information Inc.
- 6.4.8 ADATA Technology Co., Ltd.
- 6.4.9 Buffalo Inc.
- 6.4.10 Nidec Corporation
- 6.4.11 Showa Denko K.K.
- 6.4.12 Hoya Corporation
- 6.4.13 NetApp Inc.
- 6.4.14 Pure Storage Inc.
- 6.4.15 Samsung Electronics Co., Ltd. (external HDD brand)
- 6.4.16 Micron Technology Inc. (external storage systems)
- 6.4.17 Violin Systems LLC
- 6.4.18 Synology Inc.
- 6.4.19 QNAP Systems Inc.
- 6.4.20 LaCie S.A.S. (Seagate brand)
7 Market Opportunities & Future Outlook
- 7.1 White-space & Unmet-need Assessment

