
PUBLISHER: Mordor Intelligence | PRODUCT CODE: 1911713

PUBLISHER: Mordor Intelligence | PRODUCT CODE: 1911713
North America Fertilizers - Market Share Analysis, Industry Trends & Statistics, Growth Forecasts (2026 - 2031)
The North America fertilizers market is expected to grow from USD 63.76 billion in 2025 to USD 66.99 billion in 2026 and is forecast to reach USD 85.74 billion by 2031 at 5.06% CAGR over 2026-2031.
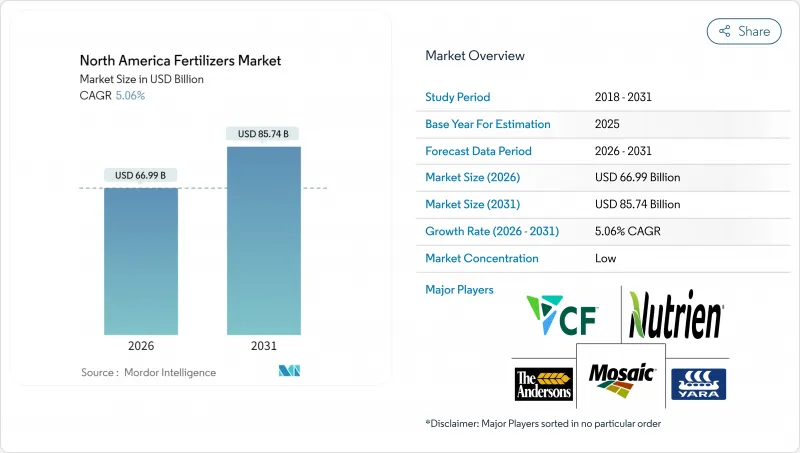
Current momentum is driven by expanding corn and soybean acreage, domestic capacity additions that reduce import risk, and precision agriculture tools that push nutrient use efficiency across roughly 270 million cultivated acres. Producers also face tightening environmental rules that reward coated and controlled-release products, while government incentives for green ammonia encourage fresh capital investment in low-carbon production assets. Supply resilience has improved after the 2021-2022 transport disruptions. However, logistics upgrades and freight cost declines continue to support the standardization of products, keeping imported potash and phosphates cost-competitive. Competitive intensity remains fragmented because regional soil variability and crop diversity limit product standardization. This opens space for specialty blenders, agronomy service firms, and platform-based challengers that tailor solutions at the field level.
North America Fertilizers Market Trends and Insights
Expansion of United States corn-and-soy acreage
Corn and soybean plantings are anticipated to reach 96.2 million acres by 2026. Each extra million acres calls for about 180,000 metric tons of nitrogen fertilizer. Growth is tied to renewable fuel standards and steady export sales. Although new hybrids use nitrogen more efficiently, the larger footprint keeps total consumption on an upward path. Most new acres sit in Iowa, Illinois, and Nebraska, where pipeline networks carry low-cost ammonia. When corn follows corn, fields need heavier nitrogen programs, which secures demand for the rest of the decade.
Shift toward specialty fertilizers for high-value crops
Fruit, nut, and vegetable growers in California's Central Valley have already adopted specialty products on roughly 2.8 million acres. Controlled-release granules cut labor and deliver steady nutrition that protects fruit size, color, and shelf life. Water-soluble lines work with fertigation systems that fine-tune feeding in avocado and citrus orchards. Organic premiums help offset the higher price of these inputs, which often run 40 to 60% above standard grades. Florida citrus growers employ the same strategy to fight disease pressure with intensive micronutrient programs.
Volatile natural-gas prices are inflating nitrogen costs
Ammonia production uses roughly 28 to 30 MMBtu of natural gas for every metric ton, so fertilizer costs rise and fall with Henry Hub futures that peaked at USD 9.50 per MMBtu during the 2024 winter heating season. Seasonal demand surges and pipeline constraints amplify the volatility. Manufacturers hedge fuel costs where possible, yet farmers still see higher prices in spring when usage spikes.
Other drivers and restraints analyzed in the detailed report include:
- Federal and state incentives for green-ammonia plants
- Biofuel blending mandates boosting nitrogen demand
- Stricter regulations on phosphate runoff in the Great Lakes basin
For complete list of drivers and restraints, kindly check the Table Of Contents.
Segment Analysis
Straight fertilizers accounted for 79.90% of North America fertilizers market share in 2025, a figure indicating that large-scale grain growers continue to rely on single nutrient products for dependable, low-cost coverage. Nitrogen grades dominate this group because the acres of corn and wheat across the Great Plains and Midwest drive steady demand. Complex blends, which combine several nutrients into one prill, post the fastest 6.72% CAGR through 2031, as specialty-crop growers favor balanced mixes that reduce application passes and lower labor costs.
Potassic grades match that 6.72% pace owing to Canada's potash mines and a wider appreciation of potassium's role in drought defense and quality gains. Coated versions of all three fertilizer types are gaining popularity rapidly because polymer and sulfur layers help curb nutrient losses and enable farms to meet water quality regulations. Precision soil tests flag growing gaps in zinc, manganese, and boron, so micronutrient add-ons within straight formulations are becoming more common. Variable rate rigs then drop the right product in the right zone, a shift that reflects an era when higher yields demand far more targeted nutrition than the old "blanket" NPK approach.
Conventional fertilizer accounted for 82.60% of revenue in 2025, as cost conscious grain producers stick with proven workhorses. The specialty fertilizer segment, is pacing the field with an 5.55% CAGR, driven by water-quality mandates and rising labor costs that favor single shot programs over multiple trips. Growers in high value fruit, nut, and vegetable sectors willingly pay premiums when slow-release coatings boost nutrient use efficiency and protect product quality.
Liquids also gain ground because they flow through injection equipment that lets operators tweak rates on the fly. Building those coatings requires significant capital and expertise, which shields established manufacturers from quick copycats. Most research now focuses on developing tougher shells and steadier release curves, ensuring that nutrient supply matches crop demand on a daily basis.
The North America Fertilizers Market Report is Segmented by Type (Complex and Straight), by Form (Conventional and Specialty), by Application Mode (Soil, Foliar, and More), by Crop Type (Field Crops, Horticultural Crops, and More), and by Geography (United States, Canada, Mexico, and More). The Market Forecasts are Provided in Terms of Value (USD) and Volume (Metric Tons).
List of Companies Covered in this Report:
- CF Industries Holdings, Inc.
- Nutrien Ltd.
- The Mosaic Company
- Yara International ASA
- The Andersons Inc.
- Haifa Chemicals Ltd.
- OCI Nitrogen
- Intrepid Potash, Inc.
- J. R. Simplot Company
- Koch Fertilizer LLC
- Wilbur-Ellis Company LLC
- K+S Aktiengesellschaft
- EuroChem Group AG
- IFFCO Canada Enterprise Ltd.
- ICL Group Ltd.
Additional Benefits:
- The market estimate (ME) sheet in Excel format
- 3 months of analyst support
TABLE OF CONTENTS
1 INTRODUCTION
- 1.1 Study Assumptions and Market Definition
- 1.2 Scope of the Study
- 1.3 Research Methodology
2 REPORT OFFERS
3 EXECUTIVE SUMMARY
4 KEY INDUSTRY TRENDS
- 4.1 Acreage of Major Crop Types
- 4.1.1 Field Crops
- 4.1.2 Horticultural Crops
- 4.2 Average Nutrient Application Rates
- 4.2.1 Micronutrients
- 4.2.1.1 Field Crops
- 4.2.1.2 Horticultural Crops
- 4.2.2 Primary Nutrients
- 4.2.2.1 Field Crops
- 4.2.2.2 Horticultural Crops
- 4.2.3 Secondary Macronutrients
- 4.2.3.1 Field Crops
- 4.2.3.2 Horticultural Crops
- 4.2.1 Micronutrients
- 4.3 Agricultural Land Equipped For Irrigation
- 4.4 Regulatory Framework
- 4.5 Value Chain and Distribution Channel Analysis
- 4.6 Market Drivers
- 4.6.1 Expansion of U.S. corn-and-soy acreage
- 4.6.2 Shift toward specialty fertilizers for high-value crops
- 4.6.3 Federal and state incentives for green-ammonia plants
- 4.6.4 Biofuel blending mandates boosting nitrogen demand
- 4.6.5 Regenerative farming driving micronutrient blends
- 4.6.6 Controlled-environment agriculture requiring water-soluble NPK
- 4.7 Market Restraints
- 4.7.1 Volatile natural-gas prices inflating nitrogen costs
- 4.7.2 Stricter regulations on phosphate runoff in the Great Lakes basin
- 4.7.3 On-farm manure nutrient recycling curbing synthetic demand
- 4.7.4 Potash logistics bottlenecks via St. Lawrence Seaway
5 MARKET SIZE AND GROWTH FORECASTS (VALUE AND VOLUME)
- 5.1 Type
- 5.1.1 Complex
- 5.1.2 Straight
- 5.1.2.1 Micronutrients
- 5.1.2.1.1 Zinc
- 5.1.2.1.2 Manganese
- 5.1.2.1.3 Copper
- 5.1.2.1.4 Iron
- 5.1.2.1.5 Boron
- 5.1.2.1.6 Molybdenum
- 5.1.2.1.7 Other Micronutrient
- 5.1.2.2 Nitrogenous
- 5.1.2.2.1 Urea
- 5.1.2.2.2 Ammonium Nitrate
- 5.1.2.2.3 Anhydrous Ammonia
- 5.1.2.2.4 Other Nitrogenous
- 5.1.2.3 Phosphatic
- 5.1.2.3.1 Monoammonium Phosphate (MAP)
- 5.1.2.3.2 Diammonium Phosphate (DAP)
- 5.1.2.3.3 Single Super Phosphate (SSP)
- 5.1.2.3.4 Triple Super Phosphate (TSP)
- 5.1.2.3.5 Other Phosphatic
- 5.1.2.4 Potassic
- 5.1.2.4.1 Muriate of Potash (MoP)
- 5.1.2.4.2 Sulfate of Potash (SoP)
- 5.1.2.4.3 Other Potassic
- 5.1.2.5 Secondary Macronutrients
- 5.1.2.5.1 Calcium
- 5.1.2.5.2 Magnesium
- 5.1.2.5.3 Sulfur
- 5.1.2.1 Micronutrients
- 5.2 By Form
- 5.2.1 Conventional
- 5.2.2 Specialty
- 5.2.2.1 Controlled Release Fertilizer (CRF)
- 5.2.2.2 Slow Release Fertilizer (SRF)
- 5.2.2.3 Liquid Fertilizers
- 5.2.2.4 Water-Soluble
- 5.3 By Application Mode
- 5.3.1 Soil
- 5.3.2 Foliar
- 5.3.3 Fertigation
- 5.4 By Crop Type
- 5.4.1 Field Crops
- 5.4.2 Horticultural Crops
- 5.4.3 Turf and Ornamental
- 5.5 By Country
- 5.5.1 United States
- 5.5.2 Canada
- 5.5.3 Mexico
- 5.5.4 Rest of North America
6 COMPETITIVE LANDSCAPE
- 6.1 Key Strategic Moves
- 6.2 Market Share Analysis
- 6.3 Company Landscape
- 6.4 Company Profiles (Includes Global Overview, Market Overview, Core Segments, Financials, Strategic Information, Market Rank/Share, Products and Services, and Recent Developments)
- 6.4.1 CF Industries Holdings, Inc.
- 6.4.2 Nutrien Ltd.
- 6.4.3 The Mosaic Company
- 6.4.4 Yara International ASA
- 6.4.5 The Andersons Inc.
- 6.4.6 Haifa Chemicals Ltd.
- 6.4.7 OCI Nitrogen
- 6.4.8 Intrepid Potash, Inc.
- 6.4.9 J. R. Simplot Company
- 6.4.10 Koch Fertilizer LLC
- 6.4.11 Wilbur-Ellis Company LLC
- 6.4.12 K+S Aktiengesellschaft
- 6.4.13 EuroChem Group AG
- 6.4.14 IFFCO Canada Enterprise Ltd.
- 6.4.15 ICL Group Ltd.
7 KEY STRATEGIC QUESTIONS FOR FERTILIZER CEOS

