
PUBLISHER: Mordor Intelligence | PRODUCT CODE: 1911714

PUBLISHER: Mordor Intelligence | PRODUCT CODE: 1911714
Europe Fertilizers - Market Share Analysis, Industry Trends & Statistics, Growth Forecasts (2026 - 2031)
The Europe fertilizers market is expected to grow from USD 55.3 billion in 2025 to USD 58.23 billion in 2026 and is forecast to reach USD 75.33 billion by 2031 at 5.29% CAGR over 2026-2031.
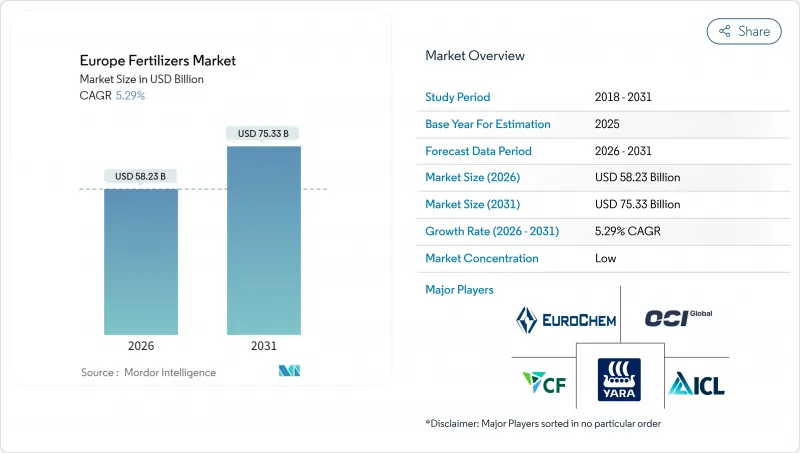
Robust demand stems from the European Union's Common Agricultural Policy eco-schemes, the Carbon Border Adjustment Mechanism, and investments in announced green-ammonia projects that will reconfigure nitrogen supply. Accelerated adoption of controlled-release and water-soluble products, growing investments in renewable energy-powered production, and the rebound in cereal acreage after the 2024 price rally further support growth. Producers face cost-side headwinds from natural-gas price volatility but are responding through vertical integration and renewable feedstock strategies. The Europe fertilizers market displays a fragmented concentration, with the top five firms controlling a minor share of the market size.
Europe Fertilizers Market Trends and Insights
EU CAP eco-schemes boosting balanced fertilization
The European Union allocates EUR 31 billion (USD 33.5 billion) each year through Common Agricultural Policy eco-schemes that reward nutrient plans minimizing nitrogen and phosphorus losses . These incentives encourage stabilized nitrogen, controlled-release coatings, and precision-application tools that align with environmental objectives. Large cereal growers in France and Germany are modernizing equipment to meet scheme criteria, driving sales of nitrification and urease inhibitors. Fertilizer firms bundle agronomy services with their products to capture value from compliance support. The program's performance-based payments reduce payback time on precision machinery, accelerating upgrades. Data-driven application planning also enhances yield consistency, reinforcing adoption momentum.
Surge in specialty fertilizer adoption for precision farming
High-resolution imagery from the Copernicus satellite program and on-farm sensors enable variable-rate applications that maximize nutrient efficiency . Controlled-release, liquid, and water-soluble formulations outperform conventional products under these data-driven regimes. Dutch greenhouse operators use fertigation dashboards that adjust nutrient mixes hourly, while Nordic cereal growers deploy coated urea to synchronize nitrogen release with crop uptake. Regional blending facilities tailor micronutrient profiles to local deficiencies, boosting efficacy. Producers offer subscription-based decision-support platforms, turning fertilizers into bundled agronomic solutions. Premium pricing is accepted because reduced losses offset higher product costs, creating a virtuous cycle for specialty growth.
Tightened nitrate and ammonia emission caps
The Netherlands caps nitrogen applications at 140 kg per hectare for grassland and 170 kg per hectare for arable crops, a cut of nearly 30% from historical norms. Denmark imposes soil-type quotas with stiff fines reaching USD 10,800 per hectare for exceedance. Farmers respond by reducing bulk urea purchases and increasing stabilized granular blends. The transition period dampens near-term demand because growers delay buying while recalibrating nutrient plans. Conventional broadcast practices face replacement by banded placement, lowering total volumes. Fertilizer companies must pivot to enhanced-efficiency lines and provide compliance advisory services, incurring additional costs yet opening premium sales.
Other drivers and restraints analyzed in the detailed report include:
- Rebound in cereal acreage after 2024 price rally
- CBAM-driven reshoring of nutrient production
- Natural-gas price volatility inflating production costs
For complete list of drivers and restraints, kindly check the Table Of Contents.
Segment Analysis
Straight fertilizers captured 76.85% of the Europe fertilizers market share in 2025, which is also the fastest-growing segment with a CAGR of 5.58% during the forecast period. Within this category, nitrogenous products are the primary nutrient input for wheat, corn, and rapeseed. The Europe fertilizers market size for complex fertilizers is growing because labor savings and single-pass convenience resonate with large German and French farms. Specialty micronutrient blends command premiums as soil tests reveal widespread zinc and boron deficiencies. Market participants invest in regional blending hubs to tailor nutrient ratios and improve delivery speed, supporting a modest but steady expansion of complex formulations.
With enhanced emission rules pushing for nutrient-use efficiency, ammonium nitrate is gaining share in emission-sensitive zones due to its lower volatilization potential. Urea remains dominant in Eastern Europe, where price sensitivity prevails. Secondary macronutrients such as sulfur experience heightened interest because sulfur deficits limit nitrogen uptake. Suppliers bundle secondary nutrients into NPK compounds to protect their share against specialty entrants. Overall, the segment's growth trajectory aligns with the broader adoption of balanced nutrition strategies and precision application technologies.
Conventional formulations accounted for 86.25% of the Europe fertilizers market size in 2025, and specialty formulations are forecast to grow at the fastest 5.72% CAGR through 2031. The Europe fertilizers market size for controlled-release coatings is expanding as polymer-coated urea demonstrates 10% yield gains in greenhouse tomatoes across Spain. Water-soluble grades serve high-density Dutch greenhouses that feed nutrients via drip systems. Liquid formulations support variable-rate aerial and tractor applications, allowing on-the-go adjustments based on sensor data. Slow-release products thrive in turf management where public green standards favor fewer applications.
Conventional granules still dominate bulk field crops because of price advantage and embedded equipment fleets. Tightening nutrient thresholds pushes growers toward specialty formulations that reduce losses and meet compliance targets. Innovators focus on biodegradable coatings and dual-nutrient release mechanisms to broaden appeal. ESG-conscious food brands prefer produce cultivated with enhanced-efficiency nutrients, influencing input choices across supply chains. Sustained R&D investment underlines the segment's role as the innovation engine of the Europe fertilizers market.
The Europe Fertilizers Market Report is Segmented by Type (Complex and Straight), by Form (Conventional and Specialty), Application Mode (Fertigation, Foliar, and Soil), Crop Type (Field Crops, Horticultural Crops, and Turf and Ornamental), and Geography (France, Germany, Italy, Netherlands, and More). The Report Offers the Market Size and Forecasts in Terms of Value (USD) and Volume (Metric Tons).
List of Companies Covered in this Report:
- Yara International ASA
- OCI Global N.V.
- EuroChem Group
- ICL Group
- CF Industries Holdings, Inc.
- Grupa Azoty S.A.
- Haifa Group
- YILDIRIM Group
- Sociedad Quimica y Minera de Chile S.A.
- Achema AB (Achemos Grupe)
- PhosAgro PJSC
- Fertiberia, S.A. (Triton)
- K+S Aktiengesellschaft
- Uralchem JSC
- Timac Agro (Groupe Roullier)
Additional Benefits:
- The market estimate (ME) sheet in Excel format
- 3 months of analyst support
TABLE OF CONTENTS
1 INTRODUCTION
- 1.1 Study Assumptions and Market Definition
- 1.2 Scope of the Study
- 1.3 Research Methodology
2 REPORT OFFERS
3 EXECUTIVE SUMMARY AND KEY FINDINGS
4 KEY INDUSTRY TRENDS
- 4.1 Acreage of Major Crop Types
- 4.1.1 Field Crops
- 4.1.2 Horticultural Crops
- 4.2 Average Nutrient Application Rates
- 4.2.1 Micronutrients
- 4.2.1.1 Field Crops
- 4.2.1.2 Horticultural Crops
- 4.2.2 Primary Nutrients
- 4.2.2.1 Field Crops
- 4.2.2.2 Horticultural Crops
- 4.2.3 Secondary Macronutrients
- 4.2.3.1 Field Crops
- 4.2.3.2 Horticultural Crops
- 4.2.1 Micronutrients
- 4.3 Agricultural Land Equipped for Irrigation
- 4.4 Regulatory Framework
- 4.5 Value Chain and Distribution Channel Analysis
- 4.6 Market Drivers
- 4.6.1 EU CAP eco-schemes boosting balanced fertilization
- 4.6.2 Surge in specialty fertilizer adoption for precision farming
- 4.6.3 Rebound in cereal acreage after 2024 price rally
- 4.6.4 Green-ammonia investments cutting supply-chain emissions
- 4.6.5 CBAM-driven reshoring of nutrient production
- 4.6.6 Rise of controlled-environment farms in Northern Europe
- 4.7 Market Restraints
- 4.7.1 Tightened nitrate and ammonia emission caps
- 4.7.2 Natural-gas price volatility inflating production costs
- 4.7.3 Rapid uptake of biostimulant substitutes
- 4.7.4 East-Europe logistics and sanction disruptions
5 MARKET SIZE AND GROWTH FORECASTS (VALUE AND VOLUME)
- 5.1 Type
- 5.1.1 Complex
- 5.1.2 Straight
- 5.1.2.1 Micronutrients
- 5.1.2.1.1 Boron
- 5.1.2.1.2 Copper
- 5.1.2.1.3 Iron
- 5.1.2.1.4 Manganese
- 5.1.2.1.5 Molybdenum
- 5.1.2.1.6 Zinc
- 5.1.2.1.7 Others
- 5.1.2.2 Nitrogenous
- 5.1.2.2.1 Ammonium Nitrate
- 5.1.2.2.2 Anhydrous Ammonia
- 5.1.2.2.3 Urea
- 5.1.2.2.4 Others
- 5.1.2.3 Phosphatic
- 5.1.2.3.1 DAP
- 5.1.2.3.2 MAP
- 5.1.2.3.3 SSP
- 5.1.2.3.4 TSP
- 5.1.2.3.5 Others
- 5.1.2.4 Potassic
- 5.1.2.4.1 MoP
- 5.1.2.4.2 SoP
- 5.1.2.4.3 Others
- 5.1.2.5 Secondary Macronutrients
- 5.1.2.5.1 Calcium
- 5.1.2.5.2 Magnesium
- 5.1.2.5.3 Sulfur
- 5.1.2.1 Micronutrients
- 5.2 Form
- 5.2.1 Conventional
- 5.2.2 Specialty
- 5.2.2.1 Controlled-Release Fertilizer (CRF)
- 5.2.2.2 Liquid Fertilizer
- 5.2.2.3 Slow-Release Fertilizer (SRF)
- 5.2.2.4 Water-Soluble
- 5.3 Application Mode
- 5.3.1 Fertigation
- 5.3.2 Foliar
- 5.3.3 Soil
- 5.4 Crop Type
- 5.4.1 Field Crops
- 5.4.2 Horticultural Crops
- 5.4.3 Turf and Ornamental
- 5.5 Geography
- 5.5.1 France
- 5.5.2 Germany
- 5.5.3 Italy
- 5.5.4 Netherlands
- 5.5.5 Russia
- 5.5.6 Spain
- 5.5.7 Ukraine
- 5.5.8 United Kingdom
- 5.5.9 Rest of Europe
6 COMPETITIVE LANDSCAPE
- 6.1 Key Strategic Moves
- 6.2 Market Share Analysis
- 6.3 Company Landscape
- 6.4 Company Profiles (Includes Global-level Overview, Market-level Overview, Core Segments, Financials as available, Strategic Information, Market Rank/Share for key companies, Products and Services, and Recent Developments)
- 6.4.1 Yara International ASA
- 6.4.2 OCI Global N.V.
- 6.4.3 EuroChem Group
- 6.4.4 ICL Group
- 6.4.5 CF Industries Holdings, Inc.
- 6.4.6 Grupa Azoty S.A.
- 6.4.7 Haifa Group
- 6.4.8 YILDIRIM Group
- 6.4.9 Sociedad Quimica y Minera de Chile S.A.
- 6.4.10 Achema AB (Achemos Grupe)
- 6.4.11 PhosAgro PJSC
- 6.4.12 Fertiberia, S.A. (Triton)
- 6.4.13 K+S Aktiengesellschaft
- 6.4.14 Uralchem JSC
- 6.4.15 Timac Agro (Groupe Roullier)
7 KEY STRATEGIC QUESTIONS FOR FERTILIZER CEOS

