
PUBLISHER: Mordor Intelligence | PRODUCT CODE: 1911738

PUBLISHER: Mordor Intelligence | PRODUCT CODE: 1911738
Indonesia Plastic Food Tray - Market Share Analysis, Industry Trends & Statistics, Growth Forecasts (2026 - 2031)
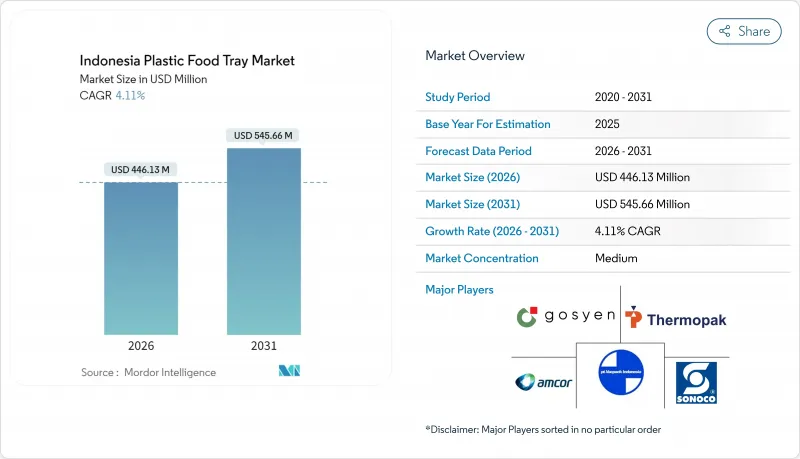
The Indonesian plastic food tray market is expected to grow from USD 428.52 million in 2025 to USD 446.13 million in 2026 and is forecast to reach USD 545.66 million by 2031 at 4.11% CAGR over 2026-2031.
Robust urban population growth, widening middle-class purchasing power, and the government's manufacturing-modernization agenda are shaping steady demand for cost-efficient, food-grade trays. Rising app-based meal delivery, election-year catering contracts, and new institutional feeding programs are together broadening the customer base for tamper-evident formats. At the same time, material-substitution pressures from proposed plastic excise taxes are spurring resin diversification, while domestic rPET build-outs promise to reduce import dependence. Competitive positioning is gradually shifting in favor of converters that incorporate automation and circular design principles to comply with stricter food-contact regulations.
Indonesia Plastic Food Tray Market Trends and Insights
Expanding Ready-to-Eat and Online Delivery Ecosystem
Digital payment rollouts and low delivery fees have pushed meal-ordering apps deep into metropolitan life, lifting tray volumes for tamper-proof packaging that safeguards food integrity during transit. Urban households now allocate 35.35% of their monthly food budgets to prepared meals, compared to 26.32% in rural districts, a gap that is most pronounced along the Jakarta-Bandung-Surabaya corridor. Five percent GDP growth through 2025 sustains discretionary spending on convenient food formats, while the Free Nutritious Meals program adds institutional pull across 30,000 serving points. Tray suppliers, therefore, gain visibility into large, recurring orders, improving capacity planning accuracy. E-commerce also raises the technical bar: stackability, leak resistance, and microwave compatibility become more important as travel distances increase.
Rapid Growth of Modern Convenience Retail Formats
Thousands of branded mini-marts entering secondary cities are replacing wet-market stalls and demanding bar-coded, barrier-packaged meat, seafood, and produce. Shelf-stable ready meals require clear lids or MAP-ready trays that showcase freshness, prevent odor transfer, and withstand longer display cycles. Retail procurement managers favor designs that enable fast stock rotation and lightweight logistics, nudging converters toward high-stiffness mono-material solutions. As cold-chain refrigerated space proliferates, thermoformed PET and PP trays capable of holding vacuum skin packs are gaining market share. Store-level sustainability pledges further stimulate interest in bio-based or recycled content, creating differentiated revenue streams for early movers.
Intensifying Regulatory Scrutiny on Food-Contact Chemicals
BPOM's draft decree lowers allowable migration thresholds for BPA, phthalates, and other additives. Converters must therefore fund new compliance tests, build documentation repositories, and sometimes switch to higher-cost monomers, raising production overheads. Multi-layer structures at risk of delamination see a compliance squeeze, redirecting R&D toward single-material barriers that still meet shelf-life specs. Smaller firms struggling to finance audits may delay new-product launches, slowing category innovation. Although alignment with EU benchmarks could unlock export lanes, domestic volume sellers see near-term margin compression as they retool.
Other drivers and restraints analyzed in the detailed report include:
- Government Push for Industry 4.0 Adoption in Food and Beverage Packaging Lines
- Surge in Domestic rPET Capacity Enabling Food-Contact Recycled Trays
- Consumer Campaigns Against Single-Use Plastics in Tier-1 Cities
For complete list of drivers and restraints, kindly check the Table Of Contents.
Segment Analysis
Polypropylene retained 41.12 of % Indonesian plastic food tray market share in 2025 due to its favorable melt-flow and cost position. The segment's reliability under heat-seal operations aligns with the service speed demands of regional quick-service restaurants. Bioplastic resins, although commanding a niche market, are growing at a 6.55% CAGR and are on track to surpass specialty polystyrene grades in value contribution by 2031. Brand-mandated recycled-content thresholds and potential excise taxes on virgin plastics improve the business case for PLA and PBS blends even after factoring in a 20-30% price premium. Indonesia's plastic food tray market size for bioplastics is forecast to expand meaningfully as local fermentation capacity scales and feedstock logistics improve. Small converters partnering with bio-resin suppliers can fast-track certification, positioning themselves as early movers on government sustainability tenders.
Material transition is, however, tempered by the limited oxygen-barrier performance of many first-generation biopolymers. Applications involving oily or high-temperature foods still favor PP or PET, unless enhanced with multilayer coatings, which complicates recycling. Resin diversification also introduces supply planning complexity, as import clearances for bio-based pellets face longer lead times. Converters hedging this risk adopt dual-recipe production lines that toggle between PP and bio-resins according to order mix, maintaining output while inching toward circular designs.
Single-compartment formats retained a commanding 45.58% share of the Indonesian plastic food tray market in 2025, thanks to their minimal tooling costs and universal applicability across rice bowls, pasta, and bakery SKUs. Unit-price sensitivity among institutional caterers entrenches this dominance. Yet lidded or MAP-compatible trays are posting a 5.72% CAGR as chilled ready meals spread from hypermarkets to convenience channels. Retailers welcome extended shelf life and odor containment, which collectively trim shrinkage and unlock longer merchandising windows. Indonesia's plastic food tray market size for lidded solutions is therefore rising fastest within supermarket ready-meal aisles.
Converters expanding into MAP must control oxygen transmission rates within tight bands, driving capex toward co-extrusion lines with EVOH or silicon oxide barriers. This capital burden is offset by higher margins that lidded formats often command 1.3 to 1.5 times the price of commodity single-compartment trays. However, post-use recycling suffers because mixed-material lids can jam municipal sorters. In response, equipment suppliers are piloting in-line laser-perforated PP lids that promise recyclability without sacrificing gas exchange control, pointing to near-term design evolution.
The Indonesia Plastic Food Tray Market Report is Segmented by Resin Type (Polyethylene Terephthalate, Polypropylene, Polystyrene, Polyvinyl Chloride, and Bioplastic), Tray Configuration (Single-Compartment, Multi-Compartment, Clamshell, and More), End User Industry (Foodservice - QSR and Cafes, and More), Application (Ready-to-eat/Take-away Meals, and More). The Market Forecasts are Provided in Terms of Value (USD).
List of Companies Covered in this Report:
- Amcor PLC
- Sonoco Products Company
- Dynapack Asia Pte Ltd
- PT Thermopak Karya Indonesia
- PT Vacpack Indonesia
- PT Gosyen Pacific Sukses Makmur
- PT Solusi Prima Packaging
- PT Amandina Bumi Nusantara
- PT Tirta Abadi
- PT Namasindo Plas
- PT Hokkan Indonesia
- PT Tridi Oasis Group
- PT Langgeng Jaya Plastindo Tbk
- PT Pelita Mekar Semesta
- PT Trimitra Chitrahasta
- PT Indopoly Swakarsa Industry Tbk
- PT Berlina Tbk
- PT Argha Karya Prima Industry Tbk
- PT Satyamitra Kemas Lestari Tbk
- PT Manuva Digital Indonesia
Additional Benefits:
- The market estimate (ME) sheet in Excel format
- 3 months of analyst support
TABLE OF CONTENTS
1 INTRODUCTION
- 1.1 Study Assumptions and Market Definition
- 1.2 Scope of the Study
2 RESEARCH METHODOLOGY
3 EXECUTIVE SUMMARY
4 MARKET LANDSCAPE
- 4.1 Market Overview
- 4.2 Market Drivers
- 4.2.1 Expanding ready-to-eat and online delivery ecosystem
- 4.2.2 Rapid growth of modern convenience retail formats
- 4.2.3 Government push for Industry 4.0 adoption in food and beverage packaging lines
- 4.2.4 Surge in domestic rPET capacity enabling food-contact recycled trays
- 4.2.5 Election-year and mega-event catering demand spikes
- 4.2.6 AI-driven thermoforming optimisation reducing unit costs for SMEs
- 4.3 Market Restraints
- 4.3.1 Intensifying regulatory scrutiny on food-contact chemicals
- 4.3.2 Consumer campaigns against single-use plastics in tier-1 cities
- 4.3.3 Fragmented cold-chain limiting high-value chilled tray uptake
- 4.3.4 Volatility in imported resin prices due to rupiah swings
- 4.4 Industry Value Chain Analysis
- 4.5 Regulatory Landscape
- 4.6 Technological Outlook
- 4.7 Porter's Five Forces Analysis
- 4.7.1 Bargaining Power of Suppliers
- 4.7.2 Bargaining Power of Buyers
- 4.7.3 Threat of New Entrants
- 4.7.4 Threat of Substitutes
- 4.7.5 Intensity of Competitive Rivalry
5 MARKET SIZE AND GROWTH FORECASTS (VALUE)
- 5.1 By Resin Type
- 5.1.1 Polyethylene Terephthalate (PET)
- 5.1.2 Polypropylene (PP)
- 5.1.3 Polystyrene (PS)
- 5.1.4 Polyvinyl Chloride (PVC)
- 5.1.5 Bioplastic (Polylactic Acid, Polybutylene Succinate)
- 5.2 By Tray Configuration
- 5.2.1 Single-compartment
- 5.2.2 Multi-compartment
- 5.2.3 Clamshell
- 5.2.4 Lidded/MAP-compatible
- 5.3 By End User Industry
- 5.3.1 Foodservice - QSR and Cafes
- 5.3.2 Institutional Catering
- 5.3.3 Food Processing Manufacturers
- 5.3.4 Modern Retail - Ready Meals and Fresh Produce
- 5.4 By Application
- 5.4.1 Ready-to-eat/Take-away Meals
- 5.4.2 Meat and Seafood
- 5.4.3 Bakery and Confectionery
- 5.4.4 Fresh-cut Fruit and Vegetables
6 COMPETITIVE LANDSCAPE
- 6.1 Market Concentration
- 6.2 Strategic Moves
- 6.3 Market Share Analysis
- 6.4 Company Profiles (includes Global level Overview, Market level overview, Core Segments, Financials as available, Strategic Information, Market Rank/Share for key companies, Products and Services, and Recent Developments)
- 6.4.1 Amcor PLC
- 6.4.2 Sonoco Products Company
- 6.4.3 Dynapack Asia Pte Ltd
- 6.4.4 PT Thermopak Karya Indonesia
- 6.4.5 PT Vacpack Indonesia
- 6.4.6 PT Gosyen Pacific Sukses Makmur
- 6.4.7 PT Solusi Prima Packaging
- 6.4.8 PT Amandina Bumi Nusantara
- 6.4.9 PT Tirta Abadi
- 6.4.10 PT Namasindo Plas
- 6.4.11 PT Hokkan Indonesia
- 6.4.12 PT Tridi Oasis Group
- 6.4.13 PT Langgeng Jaya Plastindo Tbk
- 6.4.14 PT Pelita Mekar Semesta
- 6.4.15 PT Trimitra Chitrahasta
- 6.4.16 PT Indopoly Swakarsa Industry Tbk
- 6.4.17 PT Berlina Tbk
- 6.4.18 PT Argha Karya Prima Industry Tbk
- 6.4.19 PT Satyamitra Kemas Lestari Tbk
- 6.4.20 PT Manuva Digital Indonesia
7 MARKET OPPORTUNITIES AND FUTURE OUTLOOK
- 7.1 White-space and unmet-need assessment

