
PUBLISHER: Mordor Intelligence | PRODUCT CODE: 1911743

PUBLISHER: Mordor Intelligence | PRODUCT CODE: 1911743
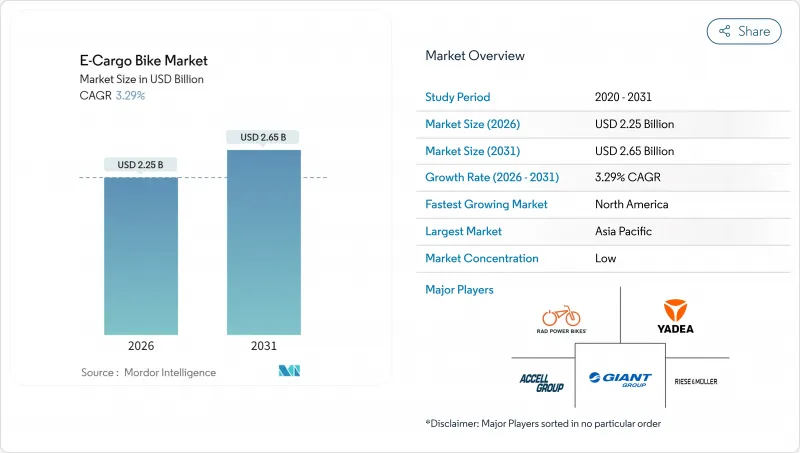
E-Cargo Bike - Market Share Analysis, Industry Trends & Statistics, Growth Forecasts (2026 - 2031)
The global e-cargo bike market is expected to grow from USD 2.18 billion in 2025 to USD 2.25 billion in 2026 and is forecast to reach USD 2.65 billion by 2031 at 3.29% CAGR over 2026-2031.
This steady trajectory reflects a clear shift from niche micromobility product to a critical component of commercial logistics infrastructure. Declining battery costs, rapid urbanization, and stricter emissions rules combine to shrink the total cost of ownership gap with conventional cargo cycles. Municipal low-emission zones now block diesel vans from dense downtown cores, so fleet operators turn to e-cargo solutions to avoid congestion fees and meet Scope 3 reporting obligations. Corporate sustainability targets accelerate adoption because every deployed bike delivers a verifiable reduction in carbon and noise. At the same time, component innovation such as mid-drive motors and integrated telematics is expanding the functional envelope of commercial cargo cycling, improving hill-climbing performance and fleet uptime.
Global E-Cargo Bike Market Trends and Insights
Growth of Last-Mile Delivery Services
Package density in large cities keeps rising and pushes fleet managers toward alternatives that navigate narrow streets and loading zones with fewer delays. Logistics operators report that e-cargo units complete peak-hour routes quicker than light vans, cutting routine parking fines and congestion fees. Amazon deployed a significant number of cargo bikes across European countries over time, signaling that the solution now scales beyond courier specialists. Emerging low-emission zones reinforce the trend because diesel entry fees often exceed the daily operating cost of an e-cargo unit. Faster drop times, fewer fines, and urban access privileges ensure that the e-cargo bike market continues to expand within metropolitan fulfillment networks .
Government Incentives and Subsidies
Fiscal instruments make purchase decisions easier for fleet accountants. The United States federal tax credit covers the acquisition price for qualifying commercial cargo e-cycles, while Germany earmarks funds for fleet grants and charging hardware. Cities, including Paris and Copenhagen, layer local rebates on top, trimming the payback horizon for high-utilization operators. Preferential access to bus lanes and exemptions from gross vehicle-weight rules add operational savings that compound the effect of direct subsidies.
High Upfront Cost vs. Conventional Cargo Bikes
Electric drivetrains significantly increase the sticker price compared to traditional human-powered cargo frames. Small businesses often lack leasing options and cannot offset capital expenditure against fuel savings quickly. The break-even point still requires significant operating hours per week in many cities. Financial institutions are gradually rolling out asset-backed products for light electric fleets, but penetration remains limited outside Europe and North America. Until capital markets mature, upfront economics will check rapid diffusion in cost-sensitive regions.
Other drivers and restraints analyzed in the detailed report include:
- Declining Lithium-Ion Battery Prices
- Expansion of Protected Cycling Infrastructure
- Limited Payload Capacity Versus Vans
For complete list of drivers and restraints, kindly check the Table Of Contents.
Segment Analysis
Pedal-assist configurations controlled 86.62% of the 2025 e-cargo bike market. The format lines up with European and Japanese legal thresholds that allow higher peak output so long as the rider is pedaling. That legal clarity lowers insurance and license costs for fleet owners. Torque-sensor systems have become more refined, adjusting power delivery by load and gradient to extend range. Throttle-assist bikes are growing at a 4.12% CAGR as North American jurisdictions relax wattage caps, yet the mode still faces tighter licensing in core European cities.
Demand patterns underscore why pedal-assist remains the workhorse for urban logistics. The technology allows continuous operation inside protected lanes without triggering motor-vehicle rules. Because pedal input remains mandatory, average energy consumption is lower than throttle alternatives, delaying mid-route charging stops. For high-density courier networks, that efficiency combines with lighter regulatory compliance to protect the total cost of ownership.
Lithium-ion packs delivered 72.58% of total shipments in 2025 and will retain the crown through 2031 at 3.62% CAGR. Energy density gains now break the 250 Wh/kg barrier, which shrinks pack size for a given range. Rising volumes from electric automotive lines feed secondary markets such as e-cargo frames, driving a favorable pricing glide path. LFP variants are winning share within the lithium family because the chemistry provides thermal stability valued by fire-safety regulators and last-mile insurers.
Lead-acid holds a foothold in entry-level Asian markets due to its low sticker price, yet fleet operators usually migrate to lithium within two replacement cycles. Longer cycle life translates into fewer battery swaps over a five-year horizon, tipping total cost of ownership toward lithium even where electricity prices are high. Enhanced battery management systems now bundle cell-balancing and temperature cutoffs, raising safety credentials and unlocking broader municipal approvals.
Mid-drive layouts secured 54.88% market share in 2025 and should widen the gap by posting a 3.84% CAGR. With the motor linked directly to the crank, torque multiplies through the bicycle drivetrain, preserving power on steep grades and under heavy cargo loads. Balanced weight distribution also means safer cornering with a full load. Hub motors keep traction on flat terrain and carry marginally lower maintenance costs, but face heat build-up when ascending hills repeatedly.
Fleet buyers gravitate toward mid-drive packages for downtown routes that feature frequent stop-start and short but steep climbs. Service intervals are slightly shorter because chains and gears experience higher loads, yet operators accept this trade-off for superior ride dynamics and lower battery drain per kilometer.
The E-Cargo Bike Market Report is Segmented by Propulsion Type (Pedal Assisted, Throttle Assisted), Battery Type (Lead Acid Battery, Lithium-Ion Battery, and More), Motor Placement (Hub (Front/Rear), Mid-Drive), Drive Systems (Chain Drive, Belt Drive), Motor Power (Below 250W, 251-350W, and More), Price Band, Sales Channel, End Use, and Geography. The Market Forecasts are Provided in Terms of Value (USD) and Volume (Units).
Geography Analysis
Asia-Pacific controlled 47.55% revenue in 2025, thanks to deep supplier ecosystems in China and regulatory headroom in Japan that approves commercial motors. Local OEMs integrate battery, motor, and chassis under one roof, driving down unit cost and shortening design cycles. As a result, the region functions both as a production hub and as the largest single demand center, especially within tier-one Chinese cities where congestion charges now favor electric cargo cycles.
North America is the fastest riser with a 6.95% CAGR to 2031. Federal tax credits, city-funded bike lane networks, and growing consumer expectations for same-day delivery combine to create a strong pull. Operators such as UPS and FedEx openly publish emission dashboards, which adds board-level pressure to pivot from vans to bikes. The environmental narrative pairs with practical advantages in gridlocked downtown cores where curbside parking tickets once ate into profit margins.
Europe maintains a mature yet still expanding opportunity. Harmonized EN 15194 certification streamlines cross-border fleet deployment, and cities such as Amsterdam and Berlin grant e-cargo bikes access to bus lanes plus loading bays outside retail stores. The combination of regulation clarity and extensive infrastructure yields stable growth. Emerging markets in South America and Africa are starting from a low base but could pick up speed once credit facilities mature and local assembly plants lower import duties.
- Accell Group
- Aima Technology Group Co. Ltd
- Bakfiets.nl
- CUBE Bikes
- DOUZE Factory SAS
- Giant Manufacturing Co. Ltd
- Jiangsu Xinri E-Vehicle Co. Ltd
- Jinhua Jobo Technology Co.
- Pedego Electric Bikes
- Pon Holding B.V.
- Rad Power Bikes Inc.
- Riese & Muller GmbH
- RYTLE GmbH
- Tern Bicycles
- Xtracycle Cargo Bikes
- XYZ CARGO
- Yadea Group Holdings Ltd.
- Yubabikes Inc.
Additional Benefits:
- The market estimate (ME) sheet in Excel format
- 3 months of analyst support
TABLE OF CONTENTS
1 Introduction
- 1.1 Study Assumptions & Market Definition
- 1.2 Scope of the Study
2 Research Methodology
3 Executive Summary
4 Market Landscape
- 4.1 Market Overview
- 4.2 Key Industry Trends
- 4.2.1 Annual Bicycle Sales
- 4.2.2 Average Selling Price & Price-Band Mix
- 4.2.3 Cross-Border Trade in E-Bikes & Parts (Imports/Exports)
- 4.2.4 E-Bike Share of Total Bicycle Sales
- 4.2.5 Commuters with 5-15 km One-Way Trips (%)
- 4.2.6 Bicycle/E-Bike Rental Market Size
- 4.2.7 E-Bike Battery Pack Price
- 4.2.8 Battery Chemistry Price Comparison
- 4.2.9 Last-Mile (Hyper-Local) Delivery Volume
- 4.2.10 Protected Bicycle Lanes (km)
- 4.2.11 E-Bike Battery Capacity (Wh)
- 4.2.12 Urban Traffic Congestion Index
- 4.2.13 Regulatory Framework
- 4.2.13.1 Homologation & Certification of E-Bicycles
- 4.2.13.2 Export-Import and Trade Regulation
- 4.2.13.3 Classification, Road Access & User Rules
- 4.2.13.4 Battery, Charger & Charging Safety
5 Market Landscape
- 5.1 Market Overview
- 5.2 Market Drivers
- 5.2.1 Growth of Last-Mile Delivery Services
- 5.2.2 Government Incentives and Subsidies
- 5.2.3 Declining Lithium-Ion Battery Prices
- 5.2.4 Expansion of Protected Cycling Infrastructure
- 5.2.5 Corporate Sustainability Reporting Pressure
- 5.2.6 Telematics-Enabled Fleet Optimization
- 5.3 Market Restraints
- 5.3.1 High Upfront Cost vs. Conventional Cargo Bikes
- 5.3.2 Limited Payload Capacity Versus Vans
- 5.3.3 Gaps in Charging Infrastructure
- 5.3.4 Fragmented Component Standards
- 5.4 Value / Supply-Chain Analysis
- 5.5 Regulatory Landscape
- 5.6 Technological Outlook
- 5.7 Porter's Five Forces
- 5.7.1 Threat of New Entrants
- 5.7.2 Bargaining Power of Suppliers
- 5.7.3 Bargaining Power of Buyers
- 5.7.4 Threat of Substitutes
- 5.7.5 Competitive Rivalry
6 Market Size & Growth Forecasts (Value (USD) and Volume (Units))
- 6.1 By Propulsion Type
- 6.1.1 Pedal Assisted
- 6.1.2 Throttle Assisted
- 6.2 By Battery Type
- 6.2.1 Lead Acid Battery
- 6.2.2 Lithium-ion Battery
- 6.2.3 Others
- 6.3 By Motor Placement
- 6.3.1 Hub (Front/Rear)
- 6.3.2 Mid-Drive
- 6.4 By Drive Systems
- 6.4.1 Chain Drive
- 6.4.2 Belt Drive
- 6.5 By Motor Power
- 6.5.1 Below 250 W
- 6.5.2 251-350 W
- 6.5.3 351-500 W
- 6.5.4 501-600 W
- 6.5.5 Above 600 W
- 6.6 By Price Band
- 6.6.1 Up to USD 1,000
- 6.6.2 USD 1,000-1,499
- 6.6.3 USD 1,500-2,499
- 6.6.4 USD 2,500-3,499
- 6.6.5 USD 3,500-5,999
- 6.6.6 Above USD 6,000
- 6.7 By Sales Channel
- 6.7.1 Online
- 6.7.2 Offline
- 6.8 By End Use
- 6.8.1 Commercial Delivery
- 6.8.1.1 Retail and Goods Delivery
- 6.8.1.2 Food and Beverage Delivery
- 6.8.2 Service Providers
- 6.8.3 Others
- 6.8.1 Commercial Delivery
- 6.9 By Geography
- 6.9.1 North America
- 6.9.1.1 United States
- 6.9.1.2 Canada
- 6.9.1.3 Mexico
- 6.9.2 South America
- 6.9.2.1 Brazil
- 6.9.2.2 Argentina
- 6.9.2.3 Rest of South America
- 6.9.3 Europe
- 6.9.3.1 Austria
- 6.9.3.2 Belgium
- 6.9.3.3 Denmark
- 6.9.3.4 France
- 6.9.3.5 Germany
- 6.9.3.6 Italy
- 6.9.3.7 Luxembourg
- 6.9.3.8 Netherlands
- 6.9.3.9 Norway
- 6.9.3.10 Poland
- 6.9.3.11 Spain
- 6.9.3.12 Sweden
- 6.9.3.13 Switzerland
- 6.9.3.14 United Kingdom
- 6.9.3.15 Rest of Europe
- 6.9.4 Asia-Pacific
- 6.9.4.1 Australia
- 6.9.4.2 China
- 6.9.4.3 India
- 6.9.4.4 Japan
- 6.9.4.5 New Zealand
- 6.9.4.6 South Korea
- 6.9.4.7 Rest of Asia-Pacific
- 6.9.5 Middle East and Africa
- 6.9.5.1 Saudi Arabia
- 6.9.5.2 United Arab Emirates
- 6.9.5.3 South Africa
- 6.9.5.4 Rest of the Middle East and Africa
- 6.9.1 North America
7 Competitive Landscape
- 7.1 Market Concentration
- 7.2 Strategic Moves
- 7.3 Market Share Analysis
- 7.4 Company Profiles (Includes Global Level Overview, Market Level Overview, Core Segments, Financials as Available, Strategic Information, Market Rank/Share for Key Companies, Products and Services, SWOT Analysis, and Recent Developments)
- 7.4.1 Accell Group
- 7.4.2 Aima Technology Group Co. Ltd
- 7.4.3 Bakfiets.nl
- 7.4.4 CUBE Bikes
- 7.4.5 DOUZE Factory SAS
- 7.4.6 Giant Manufacturing Co. Ltd
- 7.4.7 Jiangsu Xinri E-Vehicle Co. Ltd
- 7.4.8 Jinhua Jobo Technology Co.
- 7.4.9 Pedego Electric Bikes
- 7.4.10 Pon Holding B.V.
- 7.4.11 Rad Power Bikes Inc.
- 7.4.12 Riese & Muller GmbH
- 7.4.13 RYTLE GmbH
- 7.4.14 Tern Bicycles
- 7.4.15 Xtracycle Cargo Bikes
- 7.4.16 XYZ CARGO
- 7.4.17 Yadea Group Holdings Ltd.
- 7.4.18 Yubabikes Inc.
8 Market Opportunities & Future Outlook
9 Key Strategic Questions for E-Bikes CEOs

