
PUBLISHER: Mordor Intelligence | PRODUCT CODE: 1911754

PUBLISHER: Mordor Intelligence | PRODUCT CODE: 1911754
Organic Fertilizer - Market Share Analysis, Industry Trends & Statistics, Growth Forecasts (2026 - 2031)
The organic fertilizer market was valued at USD 11 billion in 2025 and estimated to grow from USD 11.99 billion in 2026 to reach USD 18.46 billion by 2031, at a CAGR of 9.03% during the forecast period (2026-2031).
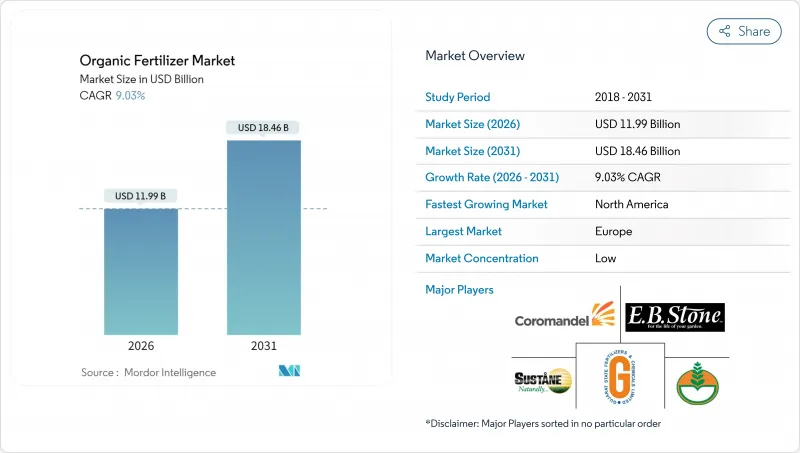
Rising sustainability mandates, consumer demand for clean-label food, and regulatory penalties on high-carbon inputs are propelling adoption across all major crop systems. Europe currently anchors market leadership, while rapid capacity expansions in North America and widening government subsidy programs tip the growth balance toward the Western Hemisphere. Technology upgrades that convert manure, food waste, and crop residues into standardized, pathogen-free granules are improving shelf life and nutrient predictability, narrowing the historical cost gap with synthetics. Simultaneously, corporate net-zero commitments are funneling long-term offtake agreements to certified producers, locking in revenue visibility and lowering investment risk.
Global Organic Fertilizer Market Trends and Insights
Government Incentives and Subsidies
Public spending is redefining the cost economics of the organic fertilizer market. The United States Department of Agriculture (USDA) Fertilizer Production Expansion Program injected USD 116.3 million in 2025 into domestic capacity, including USD 25 million for black soldier fly waste-upcycling and USD 12.8 million for on-farm manure processing. Comparable European Union funding channels, such as Ireland's organic transition grants and Germany's three-year risk-reduction packages, compress price differentials with synthetic fertilizers. These incentives align with tightening environmental rules, effectively boxing growers into lower-carbon alternatives. As subsidies reduce capital barriers, smaller facilities proliferate, increasing regional supply resilience and shortening transportation distances. When combined with voluntary carbon markets, government grants create dual revenue streams that further strengthen project economics.
Rising Consumer Demand for Organic Food
Organic food spending has remained robust, with the Organic Trade Association reporting double-digit sales growth through 2024. Health-focused younger demographics and pandemic-era purchasing habits continue to prioritize chemical-free produce. Brands are shifting procurement toward certified supply chains to hit Scope 3 emissions targets, evidenced by PepsiCo Europe's agreement to source low-carbon fertilizers annually by 2030. Premium grocery price points widen farm gate margins, allowing growers to absorb higher input costs while sustaining yields. This demand pull has convinced mainstream distributors to list organic-labeled produce as standard inventory, moving the organic fertilizer market from niche to baseline supply chain status.
Higher Production Cost Than Synthetic Fertilizers
Organic formulations remain 30-50% more expensive per nutrient unit than urea or monoammonium phosphate, mainly due to batch-based composting, longer curing cycles, and higher labor intensity. Lower nutrient density also translates to heavier application rates, raising fuel and equipment expenses during peak planting windows. While subsidies narrow the gap, many commodity growers still face thin margins that make synthetics economically compelling when stewardship rules allow. Short-haul micro-granulation plants mitigate part of the problem by cutting transport costs, yet false economies persist if regional feedstock prices spike or labor markets tighten.
Other drivers and restraints analyzed in the detailed report include:
- Environmental Regulations Limiting Chemical Fertilizers
- Expansion of Certified Organic Farmland
- Inconsistent Nutrient Content and Quality Standards
For complete list of drivers and restraints, kindly check the Table Of Contents.
Segment Analysis
Manure-based products commanded 42.58% of the organic fertilizer market share in 2025 and are projected to maintain the top slot with a 9.62% CAGR through 2031, reflecting simultaneous maturity and room for growth. The segment benefits from rising livestock populations and on-farm digesters that sanitize manure into pathogen-free pellets. Robust demand from organic row-crop growers anchors baseline volumes, while specialty fruit and nut operations are piloting foliar formulations derived from manures treated with high-temperature thermophilic composting.
Circular-economy economics underpin the manure segment's resilience. Dairy cooperatives in California feed separated solids into vermifiltration beds that yield nutrient-rich castings, monetizing what was historically a disposal liability. Patent filings on odor-control inoculants have surged, tackling a longstanding community opposition barrier to nearby manure processing. The segment also enjoys faster OMRI listing times than biosolids, owing to well-documented feedstock traceability, positioning it to capture early-adopter acreage in certification programs. As capacity expands, average haul distances shorten, trimming logistics bills and further polishing its competitive profile within the organic fertilizer market.
The Organic Fertilizer Market Report is Segmented by Form (Manure, Meal-Based Fertilizers, and More), Crop Type (Cash Crops, Horticultural Crops and Row Crops), and Geography (Africa, Asia-Pacific, Europe, and More). The Market Forecasts are Provided in Terms of Value (USD) and Volume (Metric Tons).
Geography Analysis
Europe held 40.35% of global revenues in 2025, a position rooted in the European Union Farm to Fork Strategy, which targets 25% organic farmland by 2030. Germany's subsidy program reimburses up to 70% of certification costs in the first conversion year, slashing financial risk for growers. The region's mature organic grocery sector supports stable downstream premiums, enabling compound annual consumption growth even as household spending moderates. COMPO Group's 2024 commissioning of an advanced release technology plant in Munster elevates nutrient-delivery precision, solidifying Europe as a technology trendsetter that shapes forthcoming global quality standards.
North America is the fastest-growing geography, tracking an 11.55% CAGR through 2031, lifted by the USDA Fertilizer Production Expansion Program's funding across seventy-six facilities. California concentrates a critical mass of innovation, including insect-based waste upgrade. Corporate climate declarations, especially among packaged-food giants, shift procurement into organic channels, creating pull for input suppliers. Canada's Prairie provinces now explore co-locating composting units with pulse-processing plants to recycle high-protein fines into field-applied soil amendments, boosting regional circular-economy credentials.
Asia-Pacific ranks as the largest untapped frontier. Government alliances, such as KRIBHCO partnering with Novonesis to market Rhizosuper at INR 500-600 (USD 6.3-7.5) per acre, reveal public-private strategies to bridge affordability and technical knowledge gaps. China's environmental amendments encourage polyhalite imports, providing a complementary mineral source that blends well with organic matrices. Thailand's fully integrated fertilizer park, operational since late 2024, supplies both domestic and export users, signaling the region's shift from importer to competitive exporter over the outlook period.
- Coromandel International Ltd
- Italpollina SPA
- Gujarat State Fertilizers and Chemicals Ltd
- Deepak Fertilisers and Petrochemicals Corp. Ltd
- E.B.Stone and Sons Inc
- Biolchim SPA (J.M. Huber Corporation)
- Sustane Natural Fertilizer Inc.
- Fertikal NV
- Nature Safe (Darling Ingredients Inc.)
- California Organic Fertilizers Inc. (Wilbur-Ellis Agribusiness)
- BioFert Manufacturing Inc. (Excel Industries Ltd)
- Indogulf BioAg LLC
- Midwestern BioAg
- True Organic Products Inc.
- The Espoma Company
Additional Benefits:
- The market estimate (ME) sheet in Excel format
- 3 months of analyst support
TABLE OF CONTENTS
1 INTRODUCTION
- 1.1 Study Assumptions and Market Definition
- 1.2 Scope of the Study
- 1.3 Research Methodology
2 REPORT OFFERS
3 EXECUTIVE SUMMARY AND KEY FINDINGS
4 KEY INDUSTRY TRENDS
- 4.1 Area Under Organic Cultivation
- 4.2 Per Capita Spending on Organic Products
- 4.3 Regulatory Framework
- 4.3.1 Australia
- 4.3.2 Brazil
- 4.3.3 Canada
- 4.3.4 China
- 4.3.5 France
- 4.3.6 Germany
- 4.3.7 India
- 4.3.8 Indonesia
- 4.3.9 Italy
- 4.3.10 Japan
- 4.3.11 Mexico
- 4.3.12 Netherlands
- 4.3.13 Philippines
- 4.3.14 Russia
- 4.3.15 Spain
- 4.3.16 Thailand
- 4.3.17 Turkey
- 4.3.18 United Kingdom
- 4.3.19 United States
- 4.3.20 Vietnam
- 4.4 Value Chain and Distribution Channel Analysis
- 4.5 Market Drivers
- 4.5.1 Government incentives and subsidies
- 4.5.2 Rising consumer demand for organic food
- 4.5.3 Environmental regulations limiting chemical fertilizers
- 4.5.4 Expansion of certified organic farmland
- 4.5.5 Circular-economy waste-to-fertilizer partnerships
- 4.5.6 Sensor-guided compost quality analytics
- 4.6 Market Restraints
- 4.6.1 Higher production cost than synthetic fertilizers
- 4.6.2 Inconsistent nutrient content and quality standards
- 4.6.3 Feedstock competition from bioenergy and feed industries
- 4.6.4 Logistics-emission policies penalizing bulky manure transport
5 MARKET SIZE AND GROWTH FORECASTS (VALUE AND VOLUME)
- 5.1 Form
- 5.1.1 Manure
- 5.1.2 Meal Based Fertilizers
- 5.1.3 Oilcakes
- 5.1.4 Other Organic Fertilizers
- 5.2 Crop Type
- 5.2.1 Cash Crops
- 5.2.2 Horticultural Crops
- 5.2.3 Row Crops
- 5.3 Geography
- 5.3.1 Africa
- 5.3.1.1 By Country
- 5.3.1.1.1 Egypt
- 5.3.1.1.2 Nigeria
- 5.3.1.1.3 South Africa
- 5.3.1.1.4 Rest of Africa
- 5.3.1.1 By Country
- 5.3.2 Asia-Pacific
- 5.3.2.1 By Country
- 5.3.2.1.1 Australia
- 5.3.2.1.2 China
- 5.3.2.1.3 India
- 5.3.2.1.4 Indonesia
- 5.3.2.1.5 Japan
- 5.3.2.1.6 Philippines
- 5.3.2.1.7 Thailand
- 5.3.2.1.8 Vietnam
- 5.3.2.1.9 Rest of Asia-Pacific
- 5.3.2.1 By Country
- 5.3.3 Europe
- 5.3.3.1 By Country
- 5.3.3.1.1 France
- 5.3.3.1.2 Germany
- 5.3.3.1.3 Italy
- 5.3.3.1.4 Netherlands
- 5.3.3.1.5 Russia
- 5.3.3.1.6 Spain
- 5.3.3.1.7 Turkey
- 5.3.3.1.8 United Kingdom
- 5.3.3.1.9 Rest of Europe
- 5.3.3.1 By Country
- 5.3.4 Middle East
- 5.3.4.1 By Country
- 5.3.4.1.1 Iran
- 5.3.4.1.2 Saudi Arabia
- 5.3.4.1.3 Rest of Middle East
- 5.3.4.1 By Country
- 5.3.5 North America
- 5.3.5.1 By Country
- 5.3.5.1.1 Canada
- 5.3.5.1.2 Mexico
- 5.3.5.1.3 United States
- 5.3.5.1.4 Rest of North America
- 5.3.5.1 By Country
- 5.3.6 South America
- 5.3.6.1 By Country
- 5.3.6.1.1 Argentina
- 5.3.6.1.2 Brazil
- 5.3.6.1.3 Rest of South America
- 5.3.6.1 By Country
- 5.3.1 Africa
6 COMPETITIVE LANDSCAPE
- 6.1 Key Strategic Moves
- 6.2 Market Share Analysis
- 6.3 Company Landscape
- 6.4 Company Profiles (Includes Global Level Overview, Market Level Overview, Core Segments, Financials as available, Strategic Information, Market Rank/Share, Products and Services, and Recent Developments)
- 6.4.1 Coromandel International Ltd
- 6.4.2 Italpollina SPA
- 6.4.3 Gujarat State Fertilizers and Chemicals Ltd
- 6.4.4 Deepak Fertilisers and Petrochemicals Corp. Ltd
- 6.4.5 E.B.Stone and Sons Inc
- 6.4.6 Biolchim SPA (J.M. Huber Corporation)
- 6.4.7 Sustane Natural Fertilizer Inc.
- 6.4.8 Fertikal NV
- 6.4.9 Nature Safe (Darling Ingredients Inc.)
- 6.4.10 California Organic Fertilizers Inc. (Wilbur-Ellis Agribusiness)
- 6.4.11 BioFert Manufacturing Inc. (Excel Industries Ltd)
- 6.4.12 Indogulf BioAg LLC
- 6.4.13 Midwestern BioAg
- 6.4.14 True Organic Products Inc.
- 6.4.15 The Espoma Company
7 KEY STRATEGIC QUESTIONS FOR AGRICULTURAL BIOLOGICALS CEOS

