
PUBLISHER: Mordor Intelligence | PRODUCT CODE: 1934670

PUBLISHER: Mordor Intelligence | PRODUCT CODE: 1934670
United States Activated Carbon - Market Share Analysis, Industry Trends & Statistics, Growth Forecasts (2026 - 2031)
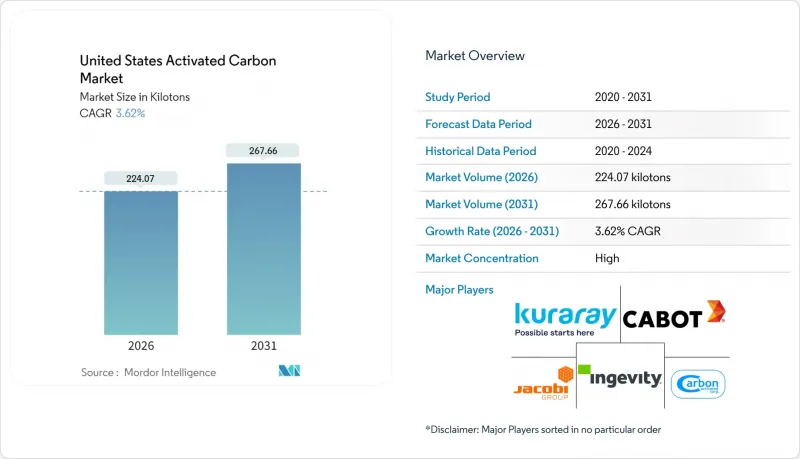
The United States Activated Carbon Market is expected to grow from 216.24 kilotons in 2025 to 224.07 kilotons in 2026 and is forecast to reach 267.66 kilotons by 2031 at 3.62% CAGR over 2026-2031.
This steady climb links directly to federal water rules that now treat granular activated carbon as the benchmark for PFAS compliance, municipal budgets earmarked for long-life adsorption beds, and growing replacements across coal plant mercury-control and petrochemical VOC streams. Infrastructure grants under the Bipartisan Infrastructure Law and separate 3M and DuPont-Chemours-Corteva settlements are underwriting large-scale treatment projects, while automotive evaporative-emission standards and domestic API manufacturing add second-layer momentum. Against these structural tailwinds, high-energy virgin activation, feedstock inflation, and emerging substitutes such as ion-exchange resins and nanofiltration membranes act as counterweights yet have not stalled capacity expansions or long-term supply contracts.
United States Activated Carbon Market Trends and Insights
EPA Regulations on PFAS in Drinking Water
The April 2024 National Primary Drinking Water Regulation established a 4 ppt limit for PFOA and PFOS, prompting the rapid procurement of granular activated carbon as Best Available Technology. Monitoring starts in April 2027, and full compliance is due by April 2029, forcing 77% of systems still lacking PFAS treatment to install beds within three years. A typical municipal plant now loads between 9,000 kg and 45,000 kg of carbon with 9- to 12-month breakthrough cycles, creating repeat demand and lifting carbon reactivation volumes. Calgon Carbon's nine-year supply pact with American Water covering more than 50 sites showcases the rush to lock in inventory, thermal reactivation slots, and logistics. Short-chain PFAS and high organic matter lessen GAC's run length, prompting hybrid pairs with powdered carbon, ion exchange, or membranes, yet this shift enlarges rather than shrinks total treatment spending.
Phase-Out of Mercury Emissions from Coal-Fired Utilities
The 2024 Mercury and Air Toxics review tightened lignite plant mercury limits from 4.0 lb to 1.2 lb per TBtu, prompting the use of brominated powdered carbon injections at 2-5 lb per million acf across 55 coal units. Arq's refined coal production underscores the tonnage scale already in place, while retrofit projects in Florida, Illinois, Kentucky, North Carolina, Texas, and West Virginia keep short-term volume buoyant. The driver contributes 0.6 percentage points to CAGR yet fades as coal retirements and carbon-capture retrofits displace aging units after 2028. The EPA's March 2025 reconsideration introduces policy risk that could lead to a reversal of long-run PAC orders.
High Energy Cost of Virgin Steam Activation
Virgin activation runs at 800-1,000°C and emits up to 9.5 kg CO2-eq per kg of coal-based carbon, triple that of thermal reactivation. Natural gas and electricity account for as much as 30% of a factory's cost, encouraging utilities to recycle spent beds through 17 U.S. reactivation furnaces, where 66% of non-hazardous carbon now finds a second life. Calgon Carbon's five domestic reactivation kilns and JACOBI's 2025 price pass-throughs illustrate the ripple effects of energy inflation. Microwave and vacuum activation trials promise 50-70% savings but remain capital-intensive pilots, keeping this drag at -0.7 percentage points through 2028.
Other drivers and restraints analyzed in the detailed report include:
- Tightening VOC Limits for Industrial Air Streams
- Rapid Expansion of Pharmaceutical API Capacity
- Competition from Silica Gel, Biochar and Advanced Membranes
For complete list of drivers and restraints, kindly check the Table Of Contents.
Segment Analysis
Granular activated carbon accounted for 45.78% of 2025 shipments, a figure that underscores its entrenched use in municipal beds designed to meet the EPA's 4 ppt PFAS ceiling. A single 30 MGD facility, such as Veolia's Stanton plant, loads 1.68 million pounds across 42 vessels, showcasing the tonnage discipline utilities lock into when entering long-dated service contracts. Granular grades ranging from 0.6 mm to 2.4 mm balance pressure drop with efficient regeneration, and five domestic kilns keep trucking lanes short for reactivation loops. Although the United States activated carbon market faces hybrid contenders, most utilities retain granular beds for multi-contaminant removal beyond PFAS, from geosmin taste episodes to agricultural runoff organics.
Extruded or pelletized forms capture the fastest 4.18% CAGR as the California Air Resources Board boosts evaporative canister standards that require uniform macropores for lifetime hydrocarbon retention. Ingevity credits 70% of its specialty carbon sales to the auto sector, yet saw a 5% dip in 2024 revenue tied to OEM destocking and Asian imports. Pellet demand also grows in commercial air purification, where cylindrical 4 mm pellets reduce the energy required by blowers. Carbonxt placed its Kentucky extrusion line onstream in Q1 2025 at 10,000 tpa, cutting lead times to Midwest and Southeast clients. Powdered activated carbon maintains seasonal swings for taste and odor spikes and brominated PAC injections for coal mercury, giving the United States activated carbon market a balanced product mosaic without undermining granular's core share.
The United States Activated Carbon Market Report is Segmented by Product Type (Powdered Activated Carbon, and Granular Activated Carbon), Raw Material (Gas Purification, Water Purification, Metal Extraction, Medicine, and More), and End-User Industry (Water Treatment, Food and Beverage, Healthcare, Automotive, Industrial Processing, and Other End-User Industries). The Market Forecasts are Provided in Terms of Volume (tons).
List of Companies Covered in this Report:
- Advanced Emissions Solutions, Inc.
- Albemarle Corporation
- Arq, Inc.
- Boyce Carbon.
- Cabot Corporation
- Carbon Activated Corporation
- CarbUSA
- CPL Activated Carbons
- Donau Chemie AG
- Evoqua Water Technologies LLC
- General Carbon Corporation
- Ingevity
- JACOBI CARBONS GROUP
- Kuraray Co., Ltd.
- Kureha Corporation
- Prominent Systems, Inc.
- Puragen Activated Carbons
- Veolia
Additional Benefits:
- The market estimate (ME) sheet in Excel format
- 3 months of analyst support
TABLE OF CONTENTS
1 Introduction
- 1.1 Study Assumptions & Market Definition
- 1.2 Scope of the Study
2 Research Methodology
3 Executive Summary
4 Market Landscape
- 4.1 Market Overview
- 4.2 Market Drivers
- 4.2.1 EPA Regulations on PFAS/PFOA in Drinking Water
- 4.2.2 Phase-Out of Mercury Emissions from Coal-Fired Utilities
- 4.2.3 Tightening VOC Limits for Industrial Air Streams
- 4.2.4 Rapid Expansion of Pharmaceutical API Capacity
- 4.2.5 Grid-Scale Supercapacitor Projects Using Activated Carbon
- 4.3 Market Restraints
- 4.3.1 High Energy Cost of Virgin Steam Activation
- 4.3.2 Competition from Silica Gel, Biochar and Advanced Membranes
- 4.3.3 Climate-Driven Supply Risk for Coconut-Shell Feedstocks
- 4.4 Value Chain Analysis
- 4.5 Porter's Five Forces
- 4.5.1 Bargaining Power of Suppliers
- 4.5.2 Bargaining Power of Consumers
- 4.5.3 Threat of New Entrants
- 4.5.4 Threat of Substitute Products and Services
- 4.5.5 Degree of Competition
5 Market Size & Growth Forecasts (Volume)
- 5.1 By Product Type
- 5.1.1 Powdered Activated Carbon
- 5.1.2 Granular Activated Carbon
- 5.1.3 Extruded or Pelletized Activated Carbon
- 5.2 By Raw Material
- 5.2.1 Gas Purification
- 5.2.2 Water Purification
- 5.2.3 Metal Extraction
- 5.2.4 Medicine
- 5.2.5 Other Applications
- 5.3 By End-User Industry
- 5.3.1 Water Treatment
- 5.3.2 Food and Beverage
- 5.3.3 Healthcare
- 5.3.4 Automotive
- 5.3.5 Industrial Processing
- 5.3.6 Other End-user Industries
6 Competitive Landscape
- 6.1 Market Concentration
- 6.2 Strategic Moves
- 6.3 Market Share (%)/ Ranking Analysis
- 6.4 Company Profiles (includes Global level Overview, Market level overview, Core Segments, Financials as available, Strategic Information, Market Rank/Share for key companies, Products & Services, and Recent Developments)
- 6.4.1 Advanced Emissions Solutions, Inc.
- 6.4.2 Albemarle Corporation
- 6.4.3 Arq, Inc.
- 6.4.4 Boyce Carbon.
- 6.4.5 Cabot Corporation
- 6.4.6 Carbon Activated Corporation
- 6.4.7 CarbUSA
- 6.4.8 CPL Activated Carbons
- 6.4.9 Donau Chemie AG
- 6.4.10 Evoqua Water Technologies LLC
- 6.4.11 General Carbon Corporation
- 6.4.12 Ingevity
- 6.4.13 JACOBI CARBONS GROUP
- 6.4.14 Kuraray Co., Ltd.
- 6.4.15 Kureha Corporation
- 6.4.16 Prominent Systems, Inc.
- 6.4.17 Puragen Activated Carbons
- 6.4.18 Veolia
7 Market Opportunities and Future Outlook
- 7.1 White-space and Unmet-Need Assessment

