
PUBLISHER: Mordor Intelligence | PRODUCT CODE: 1934763

PUBLISHER: Mordor Intelligence | PRODUCT CODE: 1934763
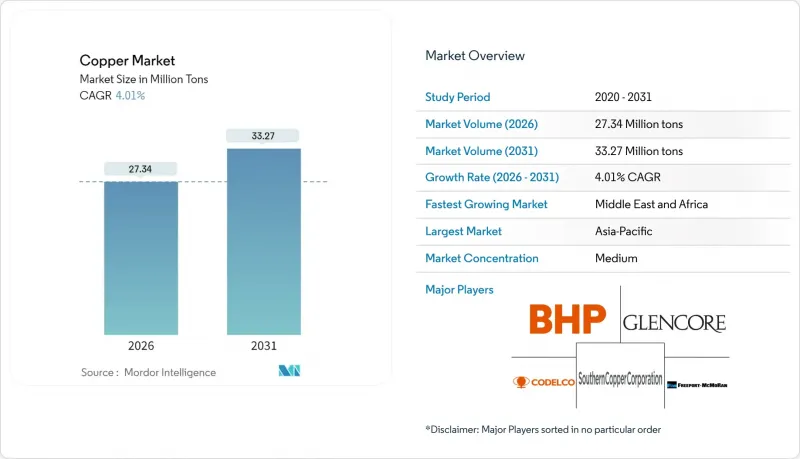
Copper - Market Share Analysis, Industry Trends & Statistics, Growth Forecasts (2026 - 2031)
Copper Market size in 2026 is estimated at 27.34 million tons, growing from 2025 value of 26.29 million tons with 2031 projections showing 33.27 million tons, growing at 4.01% CAGR over 2026-2031.
This expansion is shaped by structural electrification trends, the fivefold copper intensity of renewable-energy projects, and grid-modernization programs that collectively strain an already tight supply pipeline. Heightened demand from electric vehicles, data-center construction, and smart-city rollouts is pushing miners to accelerate brownfield expansions even as ore grades fall. Recycling's energy-efficiency advantages and lower carbon footprint make secondary supply economically and reputationally attractive to utilities, automakers, and electronics manufacturers seeking resilient procurement options. The copper market also navigates price swings triggered by speculative trading and tariff uncertainty, prompting manufacturers to lock in long-term contracts or diversify toward scrap feedstock when hedging options appear costly.
Global Copper Market Trends and Insights
Expanding Demand from Renewable Energy and Grid Electrification
A single megawatt of wind or solar capacity demands roughly five times the copper used in conventional generation, turning renewable build-outs into the strongest structural pull on the copper market. A 3 MW onshore turbine requires 4.7 short tons of copper, while a 1 MW solar array consumes 5.5 short tons. Transmission upgrades magnify the effect because High Voltage Direct Current (HVDC) links draw thousands of tons each, and grid-strengthening programs run in parallel on every continent. China's State Grid investment plan and Europe's cross-border offshore-wind backbones exemplify multi-year procurement cycles that add predictable volume to the copper market.
Rapid Growth in EV Copper Intensity
Battery-electric cars average 183 lb of copper versus 51 lb in internal-combustion models, making electrified transport a 3.6X intensity lever on the copper market. This vehicle-level demand compounds with charging infrastructure, where a single direct-current fast charger incorporates up to 17 lb of the metal. Automotive original equipment manufacturers (OEMs) are negotiating multi-year offtake contracts to secure supply ahead of production ramps surpassing mine-development timelines.
Stringent Environmental Regulations and Permitting Delays
Full-cycle mine development stretches past two decades in the Organisation for Economic Co-operation and Development (OECD) jurisdictions because environmental impact assessments, water-management plans, and community-consultation protocols impose extensive pre-construction milestones. Compliance outlays can add USD 50 million or more to project budgets and discourage greenfield proposals, motivating producers to favor brownfield expansions or acquire permitted deposits.
Other drivers and restraints analyzed in the detailed report include:
- Urban Infrastructure Expansion in Emerging Markets
- HVDC Submarine Cables for Offshore Wind
- Copper Price Volatility Driven by Speculative Trading
For complete list of drivers and restraints, kindly check the Table Of Contents.
Segment Analysis
Mining supplied 84.15% of global volume in 2025, but secondary feedstock is expanding at a 5.42% CAGR that outstrips primary output growth. The Copper market size for recycled material is rising faster than mined supply as the economics of urban mining improve once scrap grades in obsolete electronics exceed ore grades by an order of magnitude. Secondary copper production requires up to 90% less energy, aligning with corporate net-zero mandates and Environmental, Social, and Governance (ESG)-linked financing incentives.
Scaling recycling is not trivial because contamination from aluminum and iron inflates testing costs-semi-finished fabricators spend USD 28,000 per month on quality checks and still reject roughly 25 shipments annually. Despite these operational challenges, scrap supply grew 4.2% in 2024, double the rate of mined output, signaling a durable pivot toward circular-economy inputs for the copper market.
The Copper Market Report is Segmented by Source (Mining and Recycling), End-Use Industry (Building Construction, Infrastructure, Industrial, Transportation, Consumer Products and Electronic Equipment, and Others), and Geography (Asia-Pacific, North America, Europe, South America, and Middle East and Africa). The Market Forecasts are Provided in Terms of Volume (Tons).
Geography Analysis
Asia-Pacific commanded 70.30% of 2025 consumption, propelled by China's integrated smelting-to-fabrication ecosystem and India's accelerating grid build-out. China also houses 44% of global refining capacity, giving the region price-setting clout and the ability to stockpile cathode when futures curves turn backwardated.
North America and Europe remain mature but are entering renewal phases. The United States has closed four refineries since 2000, exporting 341,000 t of concentrate for overseas processing in 2023, yet the Inflation Reduction Act has earmarked funds to reshore smelting capacity. Europe's offshore-wind agenda mandates HVDC cable procurement that supports premium-grade cathode imports, while stringent recycling directives favor secondary smelters that lower Scope 3 emissions for downstream manufacturers.
The Middle East & Africa represents the fastest-growing arena, with a 5.21% CAGR forecast as sovereign-wealth investors channel capital into Zambian, DRC, and Namibian projects. Gulf states are also funding domestic downstream capacity to hedge against oil-revenue volatility, linking African feedstock with local rod and tube mills to create an emergent south-south supply chain for the copper market.
- Antofagasta plc
- Aurubis AG
- BHP
- Codelco
- First Quantum Minerals
- Freeport-McMoRan
- Glencore
- Grupo Mexico (Southern Copper Corporation)
- Hindustan Copper Limited
- Jiangxi Copper Corporation
- Kaz Minerals
- KGHM
Additional Benefits:
- The market estimate (ME) sheet in Excel format
- 3 months of analyst support
TABLE OF CONTENTS
1 Introduction
- 1.1 Study Assumptions & Market Definition
- 1.2 Scope of the Study
2 Research Methodology
3 Executive Summary
4 Market Landscape
- 4.1 Market Overview
- 4.2 Market Drivers
- 4.2.1 Expanding Demand from Renewable Energy and Grid Electrification
- 4.2.2 Rapid Growth in EV Copper Intensity
- 4.2.3 Urban Infrastructure Expansion in Emerging Markets
- 4.2.4 HVDC Submarine Cables for Offshore Wind
- 4.2.5 Antimicrobial Copper Adoption in Healthcare
- 4.3 Market Restraints
- 4.3.1 Stringent Environmental Regulations and Permitting Delays
- 4.3.2 Copper Price Volatility Driven by Speculative Trading
- 4.3.3 Competition from Lightweight Alternative Conductors
- 4.4 Value Chain Analysis
- 4.5 Porter's Five Forces Analysis
- 4.5.1 Threat of New Entrants
- 4.5.2 Bargaining Power of Buyers
- 4.5.3 Bargaining Power of Suppliers
- 4.5.4 Threat of Substitute Products
- 4.5.5 Degree of Competition
5 Market Size & Growth Forecasts (Volume)
- 5.1 By Source
- 5.1.1 Mining
- 5.1.2 Recycling
- 5.2 By End-use Industry
- 5.2.1 Building Construction
- 5.2.2 Infrastructure
- 5.2.3 Industrial
- 5.2.4 Transportation
- 5.2.5 Consumer Products and Electronic Equipment
- 5.2.6 Others
- 5.3 By Geography
- 5.3.1 Asia-Pacific
- 5.3.1.1 China
- 5.3.1.2 Japan
- 5.3.1.3 India
- 5.3.1.4 South Korea
- 5.3.1.5 Rest of Asia-Pacific
- 5.3.2 North America
- 5.3.2.1 United States
- 5.3.2.2 Canada
- 5.3.2.3 Mexico
- 5.3.3 Europe
- 5.3.3.1 Germany
- 5.3.3.2 United Kingdom
- 5.3.3.3 France
- 5.3.3.4 Italy
- 5.3.3.5 Rest of Europe
- 5.3.4 South America
- 5.3.4.1 Brazil
- 5.3.4.2 Argentina
- 5.3.4.3 Rest of South America
- 5.3.5 Middle East and Africa
- 5.3.5.1 Saudi Arabia
- 5.3.5.2 South Africa
- 5.3.5.3 Rest of Middle East and Africa
- 5.3.1 Asia-Pacific
6 Competitive Landscape
- 6.1 Market Concentration
- 6.2 Strategic Moves
- 6.3 Market Share (%)**/Ranking Analysis
- 6.4 Company Profiles (includes Global level Overview, Market level overview, Core Segments, Financials as available, Strategic Information, Market Rank/Share for key companies, Products & Services, and Recent Developments)
- 6.4.1 Antofagasta plc
- 6.4.2 Aurubis AG
- 6.4.3 BHP
- 6.4.4 Codelco
- 6.4.5 First Quantum Minerals
- 6.4.6 Freeport-McMoRan
- 6.4.7 Glencore
- 6.4.8 Grupo Mexico (Southern Copper Corporation)
- 6.4.9 Hindustan Copper Limited
- 6.4.10 Jiangxi Copper Corporation
- 6.4.11 Kaz Minerals
- 6.4.12 KGHM
7 Market Opportunities & Future Outlook
- 7.1 White-space & Unmet-need Assessment

