
PUBLISHER: Mordor Intelligence | PRODUCT CODE: 1934774

PUBLISHER: Mordor Intelligence | PRODUCT CODE: 1934774
Ballast Water Treatment - Market Share Analysis, Industry Trends & Statistics, Growth Forecasts (2026 - 2031)
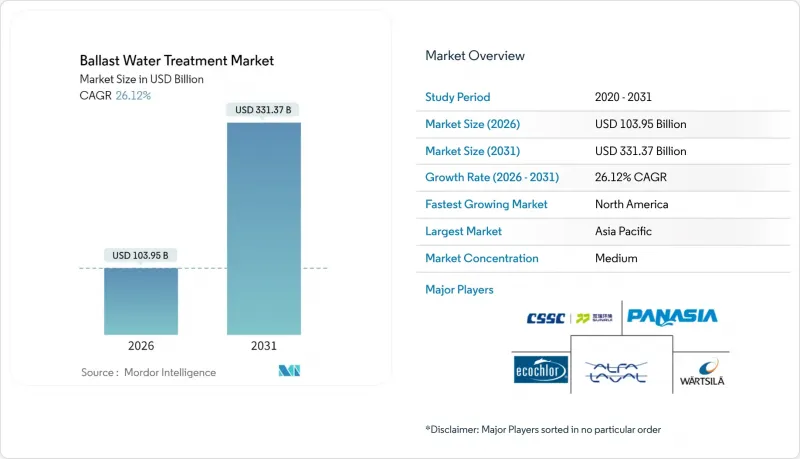
The Ballast Water Treatment Market was valued at USD 82.41 billion in 2025 and estimated to grow from USD 103.95 billion in 2026 to reach USD 331.37 billion by 2031, at a CAGR of 26.12% during the forecast period (2026-2031).
Strong regulatory enforcement, rapid technology maturation, and an unprecedented retrofit wave underpin this expansion. The International Maritime Organization (IMO) D-2 discharge limits and the U.S. Coast Guard (USCG) type-approval regime impose daily penalties of up to USD 35,000 for non-compliance, forcing operators to act. Fleet owners also weigh fuel and power savings, as the Carbon Intensity Indicator (CII) ratings increasingly shape charter premiums and financing access. Installation capacity at global dry-dock facilities remains tight, so shipyards and mobile service providers are competing for work on the roughly 30,000 vessels still awaiting retrofits.
Global Ballast Water Treatment Market Trends and Insights
Stringent IMO and USCG Compliance Deadlines
Non-conforming ballast discharge now carries daily fines of USD 35,000 under U.S. law. The IMO's 10-organisms-per-m3 standard and USCG's separate type-approval list, just 13 systems as of 2024, triggered a retrofit surge that strained shipyard slots worldwide. Turkey added ballast infractions to its pollution fine schedule in January 2025, raising penalties to TL 580.25 per gross tonnage unit. The U.S. Environmental Protection Agency Vessel Incident Discharge rule, active since November 2024, broadened federal oversight to roughly 85,000 vessels. Port State Control (PSC) records show 30% failure rates, highlighting the need for crew training and operational verification after installation.
Expansion of Global Shipping Fleet and Retrofit Wave
Roughly 30,000 vessels still need ballast water treatment systems, with retrofit costs from USD 0.5 million to USD 3 million depending on layout complexity. Shipyards in China, South Korea, and Japan hold the bulk of dry-dock reservations, yet Red Sea detours and Panama Canal drought delays have lengthened voyage times, complicating schedules. The Baltimore bridge collapse in March 2024 temporarily closed a critical U.S. port and hampered component supplies, underscoring the fragility of logistics chains. Customized engineering for LNG carriers, which dominate the premium segment, often doubles installation cost because of space and safety constraints. Mobile shore-based treatment services emerged along the U.S. Gulf Coast in 2024 to mitigate yard shortages.
High Capex and Retrofit Dry-Dock Costs
Typical installations run between USD 0.5 million and USD 3 million, a capital outlay that can equal 2-3% of a bulk carrier's fair market value. Dry-dock wait times in major Asian yards stretch 12-18 months, so owners often miss regulatory cut-offs and risk punitive fees. Price volatility for UV lamps and specialty filters widened project budgets during the 2024 supply disruptions. LNG vessels incur even higher costs because hazardous-area rules necessitate explosion-proof components and redundant safety interlocks. Financing hurdles persist for operators in low-margin trades, delaying adoption despite looming enforcement deadlines.
Other drivers and restraints analyzed in the detailed report include:
- Rapid Cost-Down in UV-Based Physical Disinfection
- Digital-Twin Analytics for Fleet-Wide BWTS Optimisation
- Crew-Training Complexity and Operational Downtime Risk
For complete list of drivers and restraints, kindly check the Table Of Contents.
Segment Analysis
The ballast water treatment market size for LNG carriers equated to 26.05% of the total value. Long-haul voyages, high capital exposure, and strict hazardous-area rules drive owners toward robust, redundancy-rich systems that command premium pricing. Over 50% of new LNG hulls now specify UV-LED reactors paired with fine-mesh filters to minimize sludge buildup and guarantee two-stage organism removal. The ballast water treatment market is seeing oil tankers accelerate at 26.23% CAGR as older VLCCs and Suezmax units queue for yard slots before 2031 compliance dates.
Container carriers prioritize schedule integrity, so they favor compact skid-mounted units that fit within tight machinery spaces and allow quick flushing cycles during short port stays. Bulk carriers confront dust and sediment issues that clog strainers, pushing many operators toward electrochlorination because of its higher tolerance for turbid water. Chemical tanker owners must avoid cross-contamination; as a result, they adopt dual-mode setups with separate neutralization tanks. The residual "other fleet" pool of ferries, offshore supply vessels, and general cargo ships benefits from falling component prices, allowing standardized packages that slash engineering lead times.
The Ballast Water Treatment Report is Segmented by Fleet Type (Oil Tankers, Bulk Carriers, LNG Carriers, Container Ships, and Other Fleet Types), Method Type (Physical and Chemical), and Geography (Asia-Pacific, North America, Europe, and Rest of the World). The Market Forecasts are Provided in Terms of Value (USD).
Geography Analysis
Asia-Pacific holds 83.60% of the global value. Dense shipbuilding clusters in South Korea, China, and Japan anchor the supply chain for reactors, filters, and control electronics, while Singapore's yards retrofit vessels transiting the Strait of Malacca on tight lay-up cycles. Regional governments provide tax incentives for green-equipment upgrades, and local class societies fast-track certification, reinforcing dominance.
North America represents a smaller base yet posts the world's fastest 28.10% CAGR through 2031, fueled by USCG enforcement and the EPA discharge rule. Great Lakes operators face unique freshwater challenges, so they often specify electrochlorination to offset cold-weather UV-dose reductions. Shore-based mobile units, such as Freedom Ballast's Gulf Coast service launched in 2024, offer compliance for small craft that cannot spare engine-room volume.
Europe maintains steady demand as early regulatory adoption seeded technology leadership, especially in mercury-free UV systems. EU ports conduct rigorous equipment audits, prompting many foreign vessels to upgrade before entering continental waters. Emerging markets in South America, the Middle East and Africa form the Rest-of-World segment, where fleet modernization and port capacity expansions gradually lift demand, although uneven enforcement tempers immediate growth.
- Alfa Laval
- ATLANTIUM TECHNOLOGIES LTD.
- BIO-UV Group
- Desmi A/S
- Ecochlor
- ERMA FIRST ESK Engineering SA
- eta plus electronic Gmbh
- HD Hyundai Heavy Industries Co., Ltd
- Headway Technology Group (Qingdao) Co. Ltd
- JFE Engineering Corporation
- KURARAY CO., LTD.
- NK Co. Ltd
- Optimarin? AS
- PANASIA CO., LTD
- Scienco/FAST
- Sunrui Marine Environment Engineering Co., Ltd.
- Wartsila
- Wuxi Brightsky Electronic Co. Ltd
- Xylem
Additional Benefits:
- The market estimate (ME) sheet in Excel format
- 3 months of analyst support
TABLE OF CONTENTS
1 Introduction
- 1.1 Study Assumptions and Market Definition
- 1.2 Scope of the Study
2 Research Methodology
3 Executive Summary
4 Market Landscape
- 4.1 Market Overview
- 4.2 Market Drivers
- 4.2.1 Stringent IMO and USCG Compliance Deadlines
- 4.2.2 Expansion of Global Shipping Fleet and Retrofit Wave
- 4.2.3 Rapid Cost-Down in UV-Based Physical Disinfection
- 4.2.4 Digital-Twin Analytics for Fleet-Wide BWTS Optimisation
- 4.2.5 Carbon-Intensity Indicator (CII) Pressure on Energy-Efficient BWTS
- 4.3 Market Restraints
- 4.3.1 High Capex and Retrofit Dry-Dock Costs
- 4.3.2 Crew-Training Complexity and Operational Downtime Risk
- 4.3.3 Component Supply Bottlenecks (UV Lamps, Specialty Filters)
- 4.4 Value Chain Analysis
- 4.5 Porter's Five Forces
- 4.5.1 Bargaining Power of Suppliers
- 4.5.2 Bargaining Power of Buyers
- 4.5.3 Threat of New Entrants
- 4.5.4 Threat of Substitutes
- 4.5.5 Degree of Competition
5 Market Size and Growth Forecasts (Value)
- 5.1 By Fleet Type
- 5.1.1 Oil Tankers
- 5.1.2 Bulk Carriers
- 5.1.3 LNG Carriers
- 5.1.4 Container Ships
- 5.1.5 Other Fleet Types (Chemical Tankers, Ferries Ships, General Cargo, Offshore Supply Vessels, etc.)
- 5.2 By Method Type
- 5.2.1 Physical
- 5.2.2 Chemical
- 5.3 By Geography
- 5.3.1 Asia-Pacific
- 5.3.1.1 China
- 5.3.1.2 India
- 5.3.1.3 Japan
- 5.3.1.4 South Korea
- 5.3.1.5 Rest of Asia-Pacific
- 5.3.2 North America
- 5.3.2.1 United States
- 5.3.2.2 Rest of North America
- 5.3.3 Europe
- 5.3.3.1 Germany
- 5.3.3.2 United Kingdom
- 5.3.3.3 France
- 5.3.3.4 Italy
- 5.3.3.5 Rest of Europe
- 5.3.4 Rest of the World
- 5.3.4.1 South America
- 5.3.4.2 Middle East and Africa
- 5.3.1 Asia-Pacific
6 Competitive Landscape
- 6.1 Market Concentration
- 6.2 Strategic Moves
- 6.3 Market Share (%)/Ranking Analysis
- 6.4 Company Profiles (includes Global level Overview, Market level overview, Core Segments, Financials as available, Strategic Information, Market Rank/Share for key companies, Products and Services, and Recent Developments)
- 6.4.1 Alfa Laval
- 6.4.2 ATLANTIUM TECHNOLOGIES LTD.
- 6.4.3 BIO-UV Group
- 6.4.4 Desmi A/S
- 6.4.5 Ecochlor
- 6.4.6 ERMA FIRST ESK Engineering SA
- 6.4.7 eta plus electronic Gmbh
- 6.4.8 HD Hyundai Heavy Industries Co., Ltd
- 6.4.9 Headway Technology Group (Qingdao) Co. Ltd
- 6.4.10 JFE Engineering Corporation
- 6.4.11 KURARAY CO., LTD.
- 6.4.12 NK Co. Ltd
- 6.4.13 Optimarin? AS
- 6.4.14 PANASIA CO., LTD
- 6.4.15 Scienco/FAST
- 6.4.16 Sunrui Marine Environment Engineering Co., Ltd.
- 6.4.17 Wartsila
- 6.4.18 Wuxi Brightsky Electronic Co. Ltd
- 6.4.19 Xylem
7 Market Opportunities and Future Outlook
- 7.1 White-space and Unmet-Need Assessment

