
PUBLISHER: Mordor Intelligence | PRODUCT CODE: 1934799

PUBLISHER: Mordor Intelligence | PRODUCT CODE: 1934799
Buy Now Pay Later Services - Market Share Analysis, Industry Trends & Statistics, Growth Forecasts (2026 - 2031)
The Buy Now Pay Later Services Market is expected to grow from USD 0.64 trillion in 2025 to USD 0.75 trillion in 2026 and is forecast to reach USD 1.65 trillion by 2031 at 17.12% CAGR over 2026-2031.
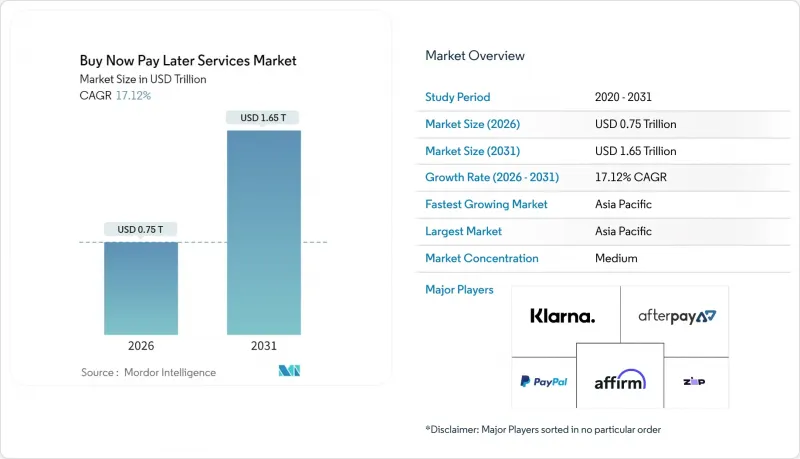
Surging embedded-credit APIs, smartphone super-apps, and real-time bureau data streams underpin this acceleration, while scale players widen merchant acceptance across discretionary and essential spend categories. Asia-Pacific anchors leadership on both volume and velocity, supported by large underbanked populations and a regulatory push for cashless ecosystems. Healthcare financing, point-of-sale (POS) integrations, and Sharia-compliant models broaden use cases, whereas European late-fee caps and higher global funding costs compress provider margins. Competitive intensity skews toward fintechs, yet deposit-rich banks leverage trust, compliance readiness, and cheap capital to expand their stake in the BNPL market.
Global Buy Now Pay Later Services Market Trends and Insights
Global open-banking mandates boosting bank-fintech BNPL interoperability
Saudi Arabia's Open Banking Framework, fully operational in 2025, lets consumers share account data securely, creating 525 fintech opportunities by 2030[1]. Similar schemes in Australia and the UK let BNPL providers pull real-time balances, tighten underwriting, and embed checkout credit within regulated verticals. Project Nexus, spearheaded by the BIS, will interlink instant-payment systems in 2026, cutting cross-border settlement friction. Collectively, these mandates enhance reach, lower fraud, and accelerate cross-sector partnerships across the buy now pay later market.
Islamic-compliant BNPL rollouts accelerating checkout adoption across GCC retail
Sharia-aligned plans structured as Murabaha or Qard Hasan propelled users from 76,000 in 2020 to over 10 million by 2025 in Saudi Arabia. Tamara and Tabby achieved unicorn status, with GCC consumers citing 67% preference for Islamic finance when available. Qatar's sandbox green-lit several BNPL players in 2024, while SAMA issued detailed late-fee disclosure rules in March 2025. Transparent terms enhance trust, boost conversion, and expand the BNPL market into faith-sensitive demographics.
EU Consumer Credit Directive late-fee caps squeezing BNPL margins
CCD2, effective 2026, extends consumer-credit scope to loans up to EUR 100,000 and caps APRs at 10% in the Netherlands, 18% in France, and 20% in Germany. Providers must run deeper affordability checks, lifting compliance spend by roughly 18% in the early years. Scale players can absorb the hit, but smaller firms may exit, nudging consolidation across the buy now pay later market.
Other drivers and restraints analyzed in the detailed report include:
- Real-time credit-bureau and open-banking data feeds enabling healthcare BNPL
- Smartphone super-apps mainstreaming micro-ticket BNPL within ride-hailing and food delivery
- Rising interest rates elevating securitization and funding costs
For complete list of drivers and restraints, kindly check the Table Of Contents.
Segment Analysis
The online segment at 64.78% share in 2025 anchors the Buy Now Pay Later services market size, yet in-store POS solutions clock a 26.75% CAGR through 2031. Retailers integrating QR or NFC split-pay buttons report a 30% upswing in conversion. Seamless links between e-commerce carts and in-aisle experiences align with 39% of shoppers who blend digital research and physical purchase.
Unified data lets providers furnish instant re-credit across channels, lowering cart abandonment and driving repeat use. As card-network tokenization simplifies terminal integration, the buy now pay later market will see rising physical retail penetration, bridging digital and brick-and-mortar journeys.
Fashion & apparel stays volume champion at 29.12% in 2025, yet healthcare & wellness expands fastest at 28.92% CAGR through 2031. Rising elective-procedure costs and high deductibles send patients toward transparent installment schedules. The Buy Now Pay Later services market size for healthcare procedures is slated to jump alongside payer integrations that embed offers into electronic health records.
As Affirm signs 130 medical merchants and FICO ingests repayment histories, approval rates climb, and default risk narrows. This accelerates segment diversification, balancing discretionary fashion cycles with essential care demand inside the buy now pay later market.
The Buy Now Pay Later Services Market is Segmented by Channel (Online and POS), End User Type (Consumer Electronics, Fashion & Apparel, Healthcare and Wellness, Home Improvement, and More), Age Group (Generation Z, Millennials, Generation X, and More), Provider (Fintech, Banks, Others), Region (North America, Europe, Asia-Pacific, and More). The Market Forecasts are Provided in Terms of Value (USD).
Geography Analysis
Asia-Pacific contributed 32.72% of 2025 revenue and races ahead at 26.10% CAGR. Super-apps like Grab and Lazada embed BNPL toggles in daily life, and Australia's 2024 decision to fold BNPL into credit-law oversight raises trust without dampening the use. Countries such as Vietnam and Indonesia show triple-digit annual volume spikes, confirming a long runway for the buy now pay later market.
North America trails only in share, yet champions product innovation. The CFPB's 2024 reclassification grants BNPL users card-equivalent dispute rights, favoring scale players with mature compliance. Use cases broaden into fuel and grocery, evidenced by a 40% surge in food-related BNPL transactions from 2023-2024, bolstering the region's portion of the BNPL market.
Europe navigates CCD2 headwinds, but e-commerce appetite and instant-credit culture sustain demand. Providers tweak merchant fees and funding maturities to protect spreads under national APR caps. Strategic processor tie-ups-Scalapay with Marqeta (2024)-enable agile adaptation, maintaining traction within the BNPL services market despite margin compression.
- Klarna AB
- Afterpay Ltd (Block Inc.)
- Affirm Holdings Inc.
- PayPal Holdings Inc.
- Zip Co Ltd
- Sezzle Inc.
- Splitit Payments Ltd
- Revolut Ltd
- LazyPay
- Scalapay S.r.l.
- Tabby FZ-LLC
- Tamara
- Openpay Group Ltd
- Sunbit Inc.
- Uplift Inc.
- ChargeAfter Inc.
- Alma SAS
- Zilch Technology Ltd
- ZestMoney
- Simpl
Additional Benefits:
- The market estimate (ME) sheet in Excel format
- 3 months of analyst support
TABLE OF CONTENTS
1 Introduction
- 1.1 Study Assumptions & Market Definition
- 1.2 Scope of the Study
2 Research Methodology
3 Executive Summary
4 Market Landscape
- 4.1 Market Overview
- 4.2 Market Drivers
- 4.2.1 Global open-banking mandates boosting bank-fintech BNPL interoperability.
- 4.2.2 Islamic-compliant BNPL rollouts accelerating checkout adoption across GCC retail
- 4.2.3 Real-time credit-bureau and open-banking data feeds enabling point-of-sale BNPL expansion into healthcare and other regulated verticals.
- 4.2.4 Smartphone-integrated super-apps mainstreaming micro-ticket BNPL within ride-hailing and food-delivery ecosystems.
- 4.2.5 Employers bundling earned-wage access with BNPL within payroll platforms, boosting repeat-purchase frequency among hourly workers.
- 4.2.6 Seamless embedding of BNPL buttons in livestream-commerce ecosystems driving higher average transaction values.
- 4.3 Market Restraints
- 4.3.1 EU Consumer Credit Directive late-fee caps squeezing BNPL margins.
- 4.3.2 Rising interest rates elevating securitisation and funding costs.
- 4.3.3 Escalating synthetic-identity fraud in fast-growing e-commerce markets inflating chargeback and collection costs for BNPL providers.
- 4.3.4 Currency volatility and high inflation in certain emerging markets widening funding-cost spreads and impairing BNPL profitability.
- 4.4 Value / Supply-Chain Analysis
- 4.5 Regulatory Outlook
- 4.6 Technological Outlook
- 4.7 Porter's Five Forces
- 4.7.1 Threat of New Entrants
- 4.7.2 Bargaining Power of Suppliers
- 4.7.3 Bargaining Power of Buyers
- 4.7.4 Threat of Substitutes
- 4.7.5 Competitive Rivalry
5 Market Size & Growth Forecasts (Value)
- 5.1 By Channel
- 5.1.1 Online
- 5.1.2 Point-of-Sale (In-store)
- 5.2 By End-Use Industry
- 5.2.1 Consumer Electronics
- 5.2.2 Fashion & Apparel
- 5.2.3 Healthcare & Wellness
- 5.2.4 Home Improvement
- 5.2.5 Travel & Leisure
- 5.2.6 Media & Entertainment
- 5.2.7 Other End-Use Industries
- 5.3 By Age Group
- 5.3.1 Generation Z (18-28 Years)
- 5.3.2 Millennials (29-44 Years)
- 5.3.3 Generation X (45-60 Years)
- 5.3.4 Baby Boomers (61-79 Years)
- 5.3.5 Silent Generation (80 Years and Above)
- 5.4 By Provider
- 5.4.1 Fintechs
- 5.4.2 Banks
- 5.4.3 Others
- 5.5 By Region
- 5.5.1 North America
- 5.5.1.1 United States
- 5.5.1.2 Canada
- 5.5.1.3 Mexico
- 5.5.2 South America
- 5.5.2.1 Brazil
- 5.5.2.2 Argentina
- 5.5.2.3 Chile
- 5.5.2.4 Peru
- 5.5.2.5 Rest of South America
- 5.5.3 Europe
- 5.5.3.1 United Kingdom
- 5.5.3.2 Germany
- 5.5.3.3 France
- 5.5.3.4 Spain
- 5.5.3.5 Italy
- 5.5.3.6 Benelux (Belgium, Netherlands, and Luxembourg)
- 5.5.3.7 Nordics (Sweden, Norway, Denmark, Finland, and Iceland)
- 5.5.3.8 Rest of Europe
- 5.5.4 Asia-Pacific
- 5.5.4.1 China
- 5.5.4.2 India
- 5.5.4.3 Japan
- 5.5.4.4 South Korea
- 5.5.4.5 Australia
- 5.5.4.6 South-East Asia (Singapore, Indonesia, Malaysia, Thailand, Vietnam, and Philippines)
- 5.5.4.7 Rest of Asia-Pacific
- 5.5.5 Middle East and Africa
- 5.5.5.1 United Arab Emirates
- 5.5.5.2 Saudi Arabia
- 5.5.5.3 South Africa
- 5.5.5.4 Nigeria
- 5.5.5.5 Rest of Middle East and Africa
- 5.5.1 North America
6 Competitive Landscape
- 6.1 Market Concentration
- 6.2 Strategic Moves
- 6.3 Market Share Analysis
- 6.4 Company Profiles (includes Global level Overview, Market level overview, Core Segments, Financials as available, Strategic Information, Market Rank/Share for key companies, Products & Services, and Recent Developments)
- 6.4.1 Klarna AB
- 6.4.2 Afterpay Ltd (Block Inc.)
- 6.4.3 Affirm Holdings Inc.
- 6.4.4 PayPal Holdings Inc.
- 6.4.5 Zip Co Ltd
- 6.4.6 Sezzle Inc.
- 6.4.7 Splitit Payments Ltd
- 6.4.8 Revolut Ltd
- 6.4.9 LazyPay
- 6.4.10 Scalapay S.r.l.
- 6.4.11 Tabby FZ-LLC
- 6.4.12 Tamara
- 6.4.13 Openpay Group Ltd
- 6.4.14 Sunbit Inc.
- 6.4.15 Uplift Inc.
- 6.4.16 ChargeAfter Inc.
- 6.4.17 Alma SAS
- 6.4.18 Zilch Technology Ltd
- 6.4.19 ZestMoney
- 6.4.20 Simpl
7 Market Opportunities & Future Outlook
- 7.1 White-space & Unmet-Need Assessment

