
PUBLISHER: Mordor Intelligence | PRODUCT CODE: 1934870

PUBLISHER: Mordor Intelligence | PRODUCT CODE: 1934870
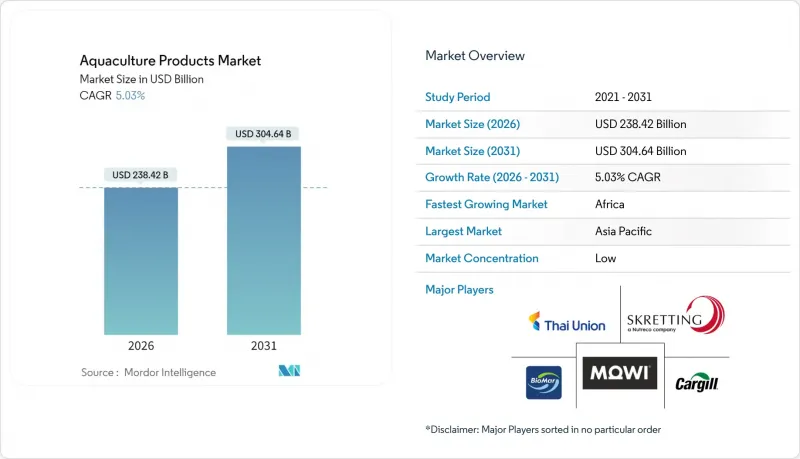
Aquaculture Products - Market Share Analysis, Industry Trends & Statistics, Growth Forecasts (2026 - 2031)
The aquaculture products market was valued at USD 227 billion in 2025 and estimated to grow from USD 238.42 billion in 2026 to reach USD 304.64 billion by 2031, at a CAGR of 5.03% during the forecast period (2026-2031).
Demand is underpinned by rising seafood consumption, declining wild-caught availability, and the rapid shift toward technology-enabled farming systems that lower unit costs while tightening biosecurity. Feed accounts for the single largest cost line, often 60-70% of production, so sustained innovation in ingredients and precision nutrition is expanding margins even as input prices fluctuate. Recirculating aquaculture systems (RAS) and artificial-intelligence-driven feeding platforms are moving from pilot to commercial scale, improving survival rates and enabling production closer to end markets. Regulatory incentives that favor closed-containment designs and sustainable sourcing standards are further accelerating capital flows into the aquaculture products market.
Global Aquaculture Products Market Trends and Insights
Rising Seafood Protein Demand
Global per-capita fish consumption continues to climb as consumers prioritize affordable, omega-3-rich proteins over red meat, lifting throughput across every production region. The Food and Agriculture Organization projects aquaculture will supply 54% of total fish output by 2032, up from 51% in 2022 . Emerging economies such as Nigeria and Kenya are experiencing acute protein shortfalls that spur public-private investment in new pond and cage farms. Retailers are expanding value-added lines, fillets, ready-to-cook meals, and functional snacks to monetize the demand uptrend. At the same time, restaurants are re-engineering menus to feature sustainably farmed species, tightening linkages between branding and responsible sourcing.
Declining Wild-Capture Fish Stocks
Many commercial species are fished at or beyond maximum sustainable yield, tightening quotas across the North Atlantic, the Mediterranean, and the Gulf of Mexico. The United States seafood trade deficit reached USD 17 billion in 2024, prompting policymakers to brand aquaculture as a food-security solution . Norway has capitalized on quota scarcity to channel investment toward land-based salmon projects, lifting harvest volumes even as biological challenges persist. Global feed formulators are also reformulating recipes to rely less on fishmeal derived from wild forage species, mitigating ecological pressure while stabilizing costs.
Disease Outbreaks and Biosecurity Costs
Pathogens such as infectious salmon anemia and early mortality syndrome can wipe out entire cohorts, imposing global losses estimated at USD 6.5 billion each year. Norway recorded 13 confirmed ISA sites in 2024, while pancreas disease surfaced at 48 new locations despite existing vaccination programs. Operators are investing in ultraviolet water treatment, multi-layer netting, and on-site diagnostic labs, but upfront spending can exceed USD 2 per kilogram of installed capacity. Smallholders in Nigeria report that biosecurity kits and veterinary visits raise unit costs beyond break-even, prompting exits that temper near-term aquaculture products market growth.
Other drivers and restraints analyzed in the detailed report include:
- Government Incentives for Sustainable Fish Farming
- Technological Adoption in Recirculating Systems
- Volatile raw-material prices
For complete list of drivers and restraints, kindly check the Table Of Contents.
Segment Analysis
Feed retained the largest slice of revenue, capturing 43.40% of the aquaculture products market share in 2025. The cost imperative drives a steady pipeline of functional additives, digestive enzymes, acidifiers, and immune modulators, each promising incremental feed-conversion gains. Multinationals and regional mills alike are experimenting with zero-fishmeal diets, fostering cross-licensing deals with insect-protein start-ups.
The equipment niche ranges from oxygen diffusers to automated graders, and demand correlates with stocking-density targets in Asia-Pacific freshwater ponds. Fertilizers are the fastest-growing segment, projected to expand at a 7.09% CAGR through 2031. Fertilizers, chemicals, additives, and pond amendments sustain traditional semi-intensive operations, particularly in South Asia. Bundled technology packages, including nutrient analytics, disease diagnostics, and micro-loans, are deepening supplier lock-in and accelerating digitization. Consequently, the aquaculture products market is tilting toward solution providers that integrate hardware, software, and consumables into single invoices.
The Global Aquaculture Products Market Report is Segmented by Product Type (Feed, Equipment, Fertilizers, Chemicals and Additives), Culture Environment (Freshwater, Marine, Brackish Water), Species (Carps, Salmonids, Tilapia, and More), and Geography (North America, South America, Europe, Asia-Pacific, Middle East, Africa). The Market Forecasts are Provided in Terms of Value (USD).
Geography Analysis
By geography, Asia-Pacific captured the lion's share of the aquaculture products market, spending at 31.70% in 2025, driven by China's scale and India's diversification into shrimp and pangasius. Government incentives, corporate-income-tax discounts, subsidized electricity, and preferential land leases continue to bolster expansion. Technology adoption is climbing fast, and Chinese producers are pivoting to higher-value groupers and sea bass, reflecting a consumer shift toward premium species. India, already the world's top shrimp exporter, is investing in broodstock centers and RAS tilapia modules to reduce biosecurity risks. These moves reinforce the region's anchor role in the aquaculture products market.
Africa is the fastest-growing region, expanding at a 7.06% CAGR through 2031. Egypt's annual output of roughly 2 million metric tons exemplifies freshwater dominance, yet resource constraints push operators toward recirculation and cage aquaculture along the Nile Delta. Sub-Saharan countries like Nigeria and Kenya are scaling tilapia hatcheries and feed mills with multilateral financing. High youth unemployment and protein deficits create a compelling socioeconomic case that attracts donor funding. Despite infrastructure gaps, the continent's upside potential is considerable for multinationals seeking first-mover advantage in the aquaculture products market.
Europe and North America chart steady mid-single-digit growth as regulatory frameworks evolve in favor of offshore and land-based systems. Norway remains the epicenter of salmon innovation, pushing closed-containment designs such as the Marine Donut and giga-smolt facilities. In the United States, the National Aquaculture Development Plan emphasizes streamlined licensing and public-private research consortia. Canada's coastal transition plan catalyzes investment in hybrid models that combine flow-through and RAS technology. Collectively, these initiatives sustain incremental demand for feeds, vaccines, and smart-farm equipment across the broader aquaculture products market landscape.
- Mowi ASA
- Nutreco
- Cargill Animal Nutrition
- BioMar Group
- Xylem
- Pentair
- AKVA Group
- Thai Union Group
- Cooke Aquaculture
- Cermaq Group
- Tassal Group
- Aller Aqua
- Elanco Animal Health
- BASF
- Alltech
- Ridley Corporation
- Innovasea
- AquaBounty Technologies
- Benchmark Holdings
Additional Benefits:
- The market estimate (ME) sheet in Excel format
- 3 months of analyst support
TABLE OF CONTENTS
1 Introduction
- 1.1 Study Assumptions and Market Definition
- 1.2 Scope of the Study
2 Research Methodology
3 Executive Summary
4 Market Landscape
- 4.1 Market Overview
- 4.2 Market Drivers
- 4.2.1 Rising seafood protein demand
- 4.2.2 Declining wild-capture fish stocks
- 4.2.3 Government incentives for sustainable fish farming
- 4.2.4 Technological adoption in recirculating systems
- 4.2.5 Growth of AI-enabled precision feeding
- 4.2.6 Expansion of insect-based feed ingredients
- 4.3 Market Restraints
- 4.3.1 Disease outbreaks and biosecurity costs
- 4.3.2 Volatile raw-material prices for fishmeal and soy
- 4.3.3 Social license pressures from ESG investors
- 4.3.4 Scarcity of marine pharmaceuticals regulatory approvals
- 4.4 Regulatory Landscape
- 4.5 Technological Outlook
- 4.6 Porter's Five Forces Analysis
- 4.6.1 Threat of New Entrants
- 4.6.2 Bargaining Power of Buyers
- 4.6.3 Bargaining Power of Suppliers
- 4.6.4 Threat of Substitutes
- 4.6.5 Intensity of Competitive Rivalry
5 Market Size and Growth Forecasts (Value)
- 5.1 By Product Type
- 5.1.1 Feed
- 5.1.2 Equipment
- 5.1.3 Fertilizers
- 5.1.4 Chemicals and Additives
- 5.2 By Culture Environment
- 5.2.1 Freshwater
- 5.2.2 Marine
- 5.2.3 Brackish Water
- 5.3 By Species
- 5.3.1 Carps
- 5.3.2 Salmonids
- 5.3.3 Tilapia
- 5.3.4 Shrimp and Prawn
- 5.3.5 Mollusks
- 5.3.6 Others (Catfish, Sea Bass, etc.)
- 5.4 By Geography
- 5.4.1 North America
- 5.4.1.1 United States
- 5.4.1.2 Canada
- 5.4.1.3 Rest of North America
- 5.4.2 South America
- 5.4.2.1 Brazil
- 5.4.2.2 Ecuador
- 5.4.2.3 Rest of South America
- 5.4.3 Europe
- 5.4.3.1 Norway
- 5.4.3.2 United Kingdom
- 5.4.3.3 Rest of Europe
- 5.4.4 Asia-Pacific
- 5.4.4.1 China
- 5.4.4.2 India
- 5.4.4.3 Rest of Asia-Pacific
- 5.4.5 Middle East
- 5.4.5.1 Saudi Arabia
- 5.4.5.2 United Arab Emirates
- 5.4.5.3 Rest of Middle East
- 5.4.6 Africa
- 5.4.6.1 Egypt
- 5.4.6.2 South Africa
- 5.4.6.3 Rest of Africa
- 5.4.1 North America
6 Competitive Landscape
- 6.1 Market Concentration
- 6.2 Strategic Moves
- 6.3 Market Share Analysis
- 6.4 Company Profiles (includes Global level Overview, Market level overview, Core Segments, Financials as available, Strategic Information, Market Rank/Share for key companies, Products and Services, and Recent Developments)
- 6.4.1 Mowi ASA
- 6.4.2 Nutreco
- 6.4.3 Cargill Animal Nutrition
- 6.4.4 BioMar Group
- 6.4.5 Xylem
- 6.4.6 Pentair
- 6.4.7 AKVA Group
- 6.4.8 Thai Union Group
- 6.4.9 Cooke Aquaculture
- 6.4.10 Cermaq Group
- 6.4.11 Tassal Group
- 6.4.12 Aller Aqua
- 6.4.13 Elanco Animal Health
- 6.4.14 BASF
- 6.4.15 Alltech
- 6.4.16 Ridley Corporation
- 6.4.17 Innovasea
- 6.4.18 AquaBounty Technologies
- 6.4.19 Benchmark Holdings
7 Market Opportunities and Future Outlook

