
PUBLISHER: Mordor Intelligence | PRODUCT CODE: 1934881

PUBLISHER: Mordor Intelligence | PRODUCT CODE: 1934881
Agrivoltaics - Market Share Analysis, Industry Trends & Statistics, Growth Forecasts (2026 - 2031)
Agrivoltaics market size in 2026 is estimated at USD 15.25 billion, growing from 2025 value of USD 11.72 billion with 2031 projections showing USD 56.83 billion, growing at 30.1% CAGR over 2026-2031.
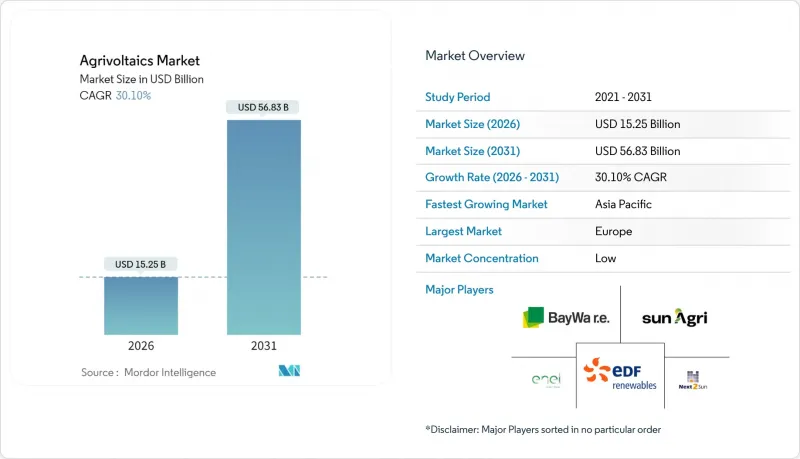
This trajectory stems from a fundamental shift in land-use economics: dual revenue streams from crops and electricity now warrant a 15-25% capital premium over conventional solar. Asia-Pacific holds 69.19% of 2024 revenue after China deployed more than 500 projects that integrate aquaculture, field crops, and livestock at a commercial scale. Europe accelerates under mandates that prohibit utility-scale arrays on productive farmland yet exempt elevated dual-use systems, while North America fast-tracks multi-gigawatt ventures that preserve farming operations. Bifacial modules, fixed-tilt racking, and ground-mounted layouts dominate current rollouts, but dynamic trackers, greenhouse roofs, and semi-transparent laminates are growing rapidly as precision agriculture data quantifies yield gains and water savings that conventional photovoltaics cannot deliver.
Global Agrivoltaics Market Trends and Insights
Subsidy-linked Feed-in Tariffs Widen Adoption
Dedicated feed-in tariffs guarantee cash flows that offset the 15-20% capital premium over ground-mount arrays. Italy's incentive covering 1.04 GW by 2026 catalyzes farmer-led ventures rather than pure-utility procurement. France followed with a 450 MW cooperative project driven by 35 growers. Japan's 2040 renewables road map prioritizes rooftop and agrivoltaic capacity, reinforcing long-run policy visibility. Early projects create performance data that lowers subsequent risk premiums, creating a virtuous adoption cycle across Europe and Asia-Pacific.
Declining Bifacial Module Prices Lift Returns
Global bifacial module costs have fallen 25-30% since 2024, raising energy density without raising land costs. Yield gains of 15-25% over monofacial panels, enhanced by snow albedo in cold climates, strengthen project economics. China's 200 GW of 2024 bifacial capacity underpins further price compression, and vertical bifacial arrays in the United Kingdom show 25.38% output gains over tilted systems. The cost trajectory suggests grid-parity agrivoltaics within three to five years, even in high-value farmland.
High Capital Expenditure Limits Early Projects
Elevated mounting structures and wider row spacing raise project capex by 15-25% versus ground-mount solar. Financing hurdles persist as lenders gauge combined crop and power revenues, although German analyses show diversified annual profits of EUR 15,000-235,000 by farm scale. Learning-curve savings from bifacial and tracking adoption are expected to reach parity by 2027.
Other drivers and restraints analyzed in the detailed report include:
- Dual-use Land Mandates Spur Structural Demand
- Crop Micro-climate Yield Premiums Validate Value
- Unclear Zoning Frameworks Slow Permitting
For complete list of drivers and restraints, kindly check the Table Of Contents.
Segment Analysis
Fixed-tilt arrays held 69.62% of the agrivoltaics market share in 2025, due to their simplicity and durability. Dynamic trackers are growing at a 31.25% CAGR as hardware premiums narrow to 8-12%; they optimize sun angles and offer variable shading for frost-prone orchards. Fraunhofer ISE's lightweight, crop-mounted modules signal next-generation designs that align with precision-farming equipment. Dynamic installations are already serving high-value segments, such as berries and lettuce, and market models suggest they can reach a 35-40% share by 2030.
Fixed configurations still dominate grassland grazing, where uniform shade enhances forage quality without seasonal adjustments. As tracker O&M costs decrease and real-time agronomic control expands, producers expect a balanced design mix that tailors panel mobility to specific crop or livestock requirements, further reducing the capital gap for the agrivoltaics market.
Bifacial modules commanded 74.52% of 2025 shipments and are advancing at 31.02% CAGR. Mass production in China and the rapid diffusion of vertical racking enable bifacial arrays to harvest light from the rear side, such as from crop canopies, soil, or snow, thereby increasing kWh per hectare without requiring additional land. UK field tests record 7.87% higher daily output than vertical monofacial setups and 25.38% better than tilted monofacial baselines, validating the performance edge.
Monofacial panels remain in low-albedo areas, but parity pricing may flip all new agrivoltaic capacity to bifacial by 2028. Semi-transparent laminates, which deliver 5-5.5% light utilization efficiency, are gaining traction for greenhouses, balancing PAR light needs with electrical autonomy. Technology roadmaps foresee tandem perovskite-silicon bifacial cells, enabling module efficiencies of over 30%, thereby amplifying the agrivoltaics market size advantage per acre.
The Agrivoltaics Market Report is Segmented by System Design (Dynamic Panel and Fixed Panel), Technology (Monofacial, Bifacial, and Translucent), Crop (Fruits, Vegetables, and Others), Placement (Greenhouses, Ground Mounted, and Shading Nets), Application (Grassland Farming, Horticulture and Arable Farming, Indoor Farming, and More), and Geography (North America, Europe, Asia-Pacific, South America, and Middle East and Africa).
Geography Analysis
Asia-Pacific retained 68.70% of global revenue during 2025, propelled by China's 500-plus operational sites spanning aquaculture, rice paddies, and goat pastures. Shandong's fish-pond systems increased shrimp yields by 50% while converting idle water surfaces into power plants. Japan mandates dual-use models to achieve its 40-50% renewable electricity goal by 2040, financing sheltered rooftop and farmland arrays. India's low-cost steel canopies suit smallholder plots, while South Korea quantifies biofuel potential from agri-PV integration.
Europe is the fastest-growing region at a 31.60% CAGR. Italy's ban on ground-mount solar panels over fertile soil, coupled with a EUR 1.7 billion incentive fund, is funneling developers into agrivoltaics. France's Terr'Arbouts, covering 7 km2 with 35 farmer partners, and Germany's SUNfarming-SPIE 753 MW park illustrate scale readiness. Snow-rich Nordic nations exploit bifacial rear-side gains during low-sun winters, reinforcing continental momentum.
North America scales via mixed-use mega-sites. Ohio's 800 MW solar-plus-300 MW storage complex reserves two-thirds of the acreage for crops, signaling regulatory acceptance. Vermont's vertical design retains 90% farmland utility. The Federal LASSO Prize funding combines cattle grazing with solar energy, and the USDA-DOE research alliance generates agronomic datasets that mitigate risk and increase capital inflows. Mexico's indigenous pilot arrays demonstrate that agrivoltaics can reduce diesel pump costs and enhance maize yields in marginalized communities.
South America and the Middle East & Africa remain nascent. Colombia's early-stage sites and Qatar's semi-transparent lettuce greenhouses highlight exploratory but promising footholds. These regions may experience cost declines post-2027, mirroring the diffusion curves of rooftop solar.
- Sun'Agri
- Enel Green Power
- BayWa r.e.
- Fraunhofer ISE
- Next2Sun
- Insolight
- REM TEC
- Kyocera Corporation
- Acciona Energia
- EDF Renewables
- Zimmermann PV-Stahlbau
- Scatec ASA
- Arava Power Company
- Ameresco
- ENGIE SA
- R.Power Group
- TNO
- Hevel Solar
- Local Agri-solar Cooperatives
Additional Benefits:
- The market estimate (ME) sheet in Excel format
- 3 months of analyst support
TABLE OF CONTENTS
1 Introduction
- 1.1 Study Assumptions & Market Definition
- 1.2 Scope of the Study
2 Research Methodology
3 Executive Summary
4 Market Landscape
- 4.1 Market Overview
- 4.2 Market Drivers
- 4.2.1 Subsidy-linked FiT programs (EU, Asia)
- 4.2.2 Declining bifacial PV module prices
- 4.2.3 Dual-use land mandates in land-scarce nations
- 4.2.4 Crop micro-climate yield premiums Over 10 %
- 4.2.5 Carbon-credit stacking in agri-solar PPAs
- 4.2.6 Ag insurance discounts for shade-reduced evapotranspiration
- 4.3 Market Restraints
- 4.3.1 High capex vs. ground-mount PV
- 4.3.2 Unclear agri-zoning regulations
- 4.3.3 Module soiling from crop residues
- 4.3.4 Agronomic-PV labor skill gap
- 4.4 Supply-Chain Analysis
- 4.5 Regulatory Landscape
- 4.6 Technological Outlook
- 4.7 Porter's Five Forces
- 4.7.1 Threat of New Entrants
- 4.7.2 Bargaining Power of Buyers
- 4.7.3 Bargaining Power of Suppliers
- 4.7.4 Threat of Substitutes
- 4.7.5 Competitive Rivalry
5 Market Size & Growth Forecasts
- 5.1 By System Design
- 5.1.1 Dynamic Panel
- 5.1.2 Fixed Panel
- 5.2 By Technology
- 5.2.1 Monofacial
- 5.2.2 Bifacial
- 5.2.3 Translucent
- 5.3 By Crop
- 5.3.1 Fruits
- 5.3.2 Vegetables
- 5.3.3 Others
- 5.4 By Placement
- 5.4.1 Greenhouses
- 5.4.2 Ground Mounted
- 5.4.3 Shading Nets
- 5.5 By Application
- 5.5.1 Grassland Farming
- 5.5.2 Horticulture and Arable Farming
- 5.5.3 Indoor Farming
- 5.5.4 Pollinator Habitat
- 5.6 By Geography
- 5.6.1 North America
- 5.6.1.1 United States
- 5.6.1.2 Canada
- 5.6.1.3 Mexico
- 5.6.2 Europe
- 5.6.2.1 Germany
- 5.6.2.2 United Kingdom
- 5.6.2.3 France
- 5.6.2.4 Italy
- 5.6.2.5 NORDIC Countries
- 5.6.2.6 Russia
- 5.6.2.7 Rest of Europe
- 5.6.3 Asia-Pacific
- 5.6.3.1 China
- 5.6.3.2 India
- 5.6.3.3 Japan
- 5.6.3.4 South Korea
- 5.6.3.5 ASEAN Countries
- 5.6.3.6 Rest of Asia-Pacific
- 5.6.4 South America
- 5.6.4.1 Brazil
- 5.6.4.2 Argentina
- 5.6.4.3 Rest of South America
- 5.6.5 Middle East and Africa
- 5.6.5.1 Saudi Arabia
- 5.6.5.2 United Arab Emirates
- 5.6.5.3 South Africa
- 5.6.5.4 Egypt
- 5.6.5.5 Rest of Middle East and Africa
- 5.6.1 North America
6 Competitive Landscape
- 6.1 Market Concentration
- 6.2 Strategic Moves (M&A, Partnerships, PPAs)
- 6.3 Market Share Analysis (Market Rank/Share for key companies)
- 6.4 Company Profiles (includes Global level Overview, Market level overview, Core Segments, Financials as available, Strategic Information, Products & Services, and Recent Developments)
- 6.4.1 Sun'Agri
- 6.4.2 Enel Green Power
- 6.4.3 BayWa r.e.
- 6.4.4 Fraunhofer ISE
- 6.4.5 Next2Sun
- 6.4.6 Insolight
- 6.4.7 REM TEC
- 6.4.8 Kyocera Corporation
- 6.4.9 Acciona Energia
- 6.4.10 EDF Renewables
- 6.4.11 Zimmermann PV-Stahlbau
- 6.4.12 Scatec ASA
- 6.4.13 Arava Power Company
- 6.4.14 Ameresco
- 6.4.15 ENGIE SA
- 6.4.16 R.Power Group
- 6.4.17 TNO
- 6.4.18 Hevel Solar
- 6.4.19 Local Agri-solar Cooperatives
7 Market Opportunities & Future Outlook
- 7.1 White-Space & Unmet-Need Assessment

