
PUBLISHER: Mordor Intelligence | PRODUCT CODE: 1934911

PUBLISHER: Mordor Intelligence | PRODUCT CODE: 1934911
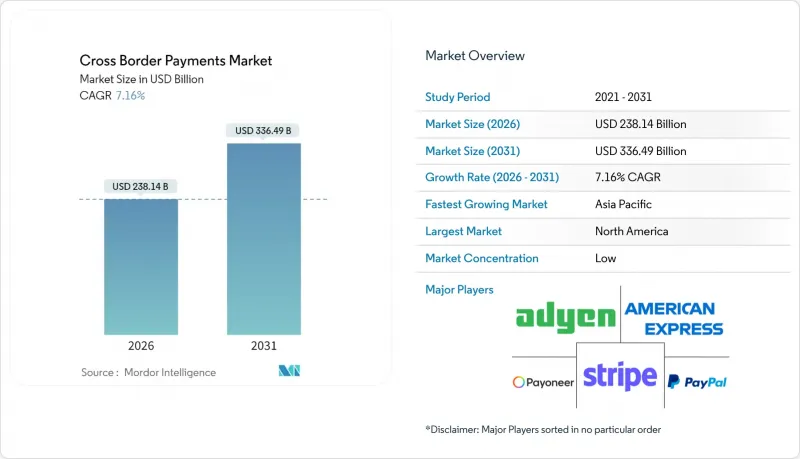
Cross Border Payments - Market Share Analysis, Industry Trends & Statistics, Growth Forecasts (2026 - 2031)
The cross border payments market is expected to grow from USD 222.23 billion in 2025 to USD 238.14 billion in 2026 and is forecast to reach USD 336.49 billion by 2031 at 7.16% CAGR over 2026-2031.
Sustained demand for friction-free international commerce, rapid digital wallet penetration and the rollout of ISO 20022 across major clearing systems are reinforcing volume growth. Global e-commerce sellers are expanding their supplier bases, which raises B2B transaction counts and average ticket sizes. Parallel advances in faster-payment interlinking and AI-led compliance screening are compressing settlement cycles and attracting new enterprise users. Fintech entrants are pressuring incumbents on transparency and pricing, prompting consolidation as large processors seek scale benefits. Despite the momentum, the market confronts cost headwinds from exotic-FX mark-ups and correspondent bank retrenchment in higher-risk corridors, issues that temper margin expansion.
Global Cross Border Payments Market Trends and Insights
Rising B2B E-commerce Export Volumes in Asia
B2B merchants across China, India and the ASEAN bloc are accelerating international online sales, lifting settlement values that flow through payment gateways and marketplaces. Transaction corridors such as China-ASEAN recorded USD 151.7 billion in 2024, a 14.3% year-on-year jump. Platform sellers now prefer card-on-file and local wallet options, displacing letters of credit in mid-ticket trade. Payment providers able to interface with regional fast-payment rails and harmonise KYC standards are winning share from legacy correspondent networks. Governing bodies in Indonesia and Vietnam support this transition through streamlined import-export licensing, which further secures cross-border volume growth. Together, these shifts add an estimated 1.2 percentage points to the sector's CAGR.
Growing Adoption of ISO 20022 Messaging Standards in EU Payment Hubs
Europe's phased migration to ISO 20022 enriches data fields and standardises reference formats, directly reducing repair rates and AML false positives. As of December 2024 only 32.9% of corporates had switched, yet full adoption is required by November 2025. The CHIPS network's smooth conversion, with 555,345 USD-denominated messages on day one, illustrates the processing uplift possible. Banks are deploying analytics that exploit the extended remittance sections to speed reconciliation, a feature especially valuable for corporates operating shared-service centres. The enhanced structure enables new value-added services, such as real-time exception handling, which lifts throughput and supports a 0.8 percentage-point contribution to growth.
De-Risking by Global Banks Cutting Correspondent Lines in Africa
Large international banks continue to exit perceived high-risk corridors to avoid hefty AML penalties. The World Bank notes that local lenders in 21 African states now face fewer than three USD correspondent lines, limiting trade settlement options. Export-oriented SMEs in Kenya and Ghana cite payment rejection rates above 15%, forcing them to route funds through expensive third-country intermediaries. The reduced connectivity dampens remittance inflows and constrains e-commerce participation, shaving roughly 0.9 percentage points from industry growth. Regional payment switches such as PAPSS attempt to bridge the gap, yet coverage and liquidity remain nascent.
Other drivers and restraints analyzed in the detailed report include:
- SWIFT gpi and Instant FX Windows Boosting Same-Day Settlement Demand
- PSD3-Driven Open-Banking APIs Accelerating European Cross-Border P2P
- Persistently High FX Mark-Ups on Exotic Currency Corridors
For complete list of drivers and restraints, kindly check the Table Of Contents.
Segment Analysis
B2B flows generated 59.42% of the cross border payments market share in 2025, underpinned by complex supply-chain settlements and rising mid-cap multinational activity. The cross border payments market size for B2B transactions is projected to increase from USD 39.3 trillion in 2023 to USD 59.2 trillion by 2031, mirroring procurement digitisation and wider e-invoicing mandates. Corporates leverage data-rich ISO 20022 fields to automate three-way matching, reducing dispute cycles and lowering working-capital drag. Treasury managers are also testing distributed-ledger-based payment-versus-payment (PvP) solutions to compress settlement risk on longer-dated supply contracts.
Consumer-to-consumer payments, while accounting for a smaller volume base, exhibit the fastest CAGR at 8.76% as migrant workers embrace app-based remittance offerings. The cross border payments market size for this segment is set to accelerate in corridors such as US-Mexico, where stablecoin penetration cut average fees to below 1% in 2023. Super-apps are embedding micro-savings, micro-credit and bill-pay functions, increasing retention and cross-sell potential. Providers that layer loyalty rewards in local currencies can capture further wallet share without raising compliance burden.
Bank transfers commanded 44.88% of the cross border payments market size in 2025, benefiting from entrenched trust, balance-sheet depth and SWIFT connectivity. Instant settlement services such as CHAPS extension and Fedwire ISO migration increase throughput and relevance. Yet retail customers still face opaque fees, sustaining a user base for agile money-transfer operators. MTOs post the quickest CAGR at 8.05%, propelled by API integration, card tokenisation and dynamic FX rate engines. Providers like Wise advertise mid-market pricing and near-real-time delivery, positioning themselves as alternatives for small-order trade and freelancer payouts.
Card-based flows remain prominent in digital marketplaces; US-issued cards facilitated 7.5 billion cross-border purchases in 2022. Card networks are layering network-tokenised credentials and deploying multicurrency settlement to sharpen value propositions. Meanwhile, emerging blockchain channels register double-digit growth from a low base; however, regulatory uncertainty over wallet KYC slows mainstream adoption outside select remittance corridors.
The Cross Border Payments Market Report is Segmented by Transaction Type (B2B, C2C, and More), Channel (Bank Transfers (SWIFT, ACH, RTP), Cards, and More), Enterprise Size (SMEs, Large Enterprises), End-User (Business Enterprises, Individuals / Consumers, Government), and Geography. The Market Forecasts are Provided in Terms of Value (USD).
Geography Analysis
North America retained 34.42% of the cross border payments market in 2025, driven by deep capital markets, high-card penetration and robust B2B trade with Asia and Europe. US-issued cards supported USD 0.47 trillion in cross-border spend in 2022, a more than threefold rise since 2018 [frbservices.org]. FedNow's domestic real-time rails create a foundation for eventual cross-border linkages, though the Harvard Kennedy School observes slower nationwide adoption relative to peers [hks.harvard.edu]. Canada's RTR and Mexico's CoDi demonstrate incremental progress toward North American real-time harmonisation.
Asia-Pacific delivers the fastest regional CAGR of 9.06%. E-commerce gross merchandise value is projected to surpass USD 28.9 trillion by 2026. Digital wallets such as Alipay and GrabPay now dominate checkout pages, reducing reliance on card networks. India's UPI and Singapore's PayNow have launched bilateral QR reciprocity, with the BIS-backed Nexus pilot set to extend coverage to Malaysia and the Philippines. High smartphone penetration and supportive regulators underpin the trajectory.
Europe maintains a strong second position. The European Commission targets a fully integrated payments market, and PSD3 is expected to harmonise dispute resolution mechanisms. SEPA Instant Credit Transfer adoption topped 67% of euro-area PSPs in 2024, cutting average euro-domestic transfers to under 10 seconds. ISO 20022 alignment enhances cross-border straight-through processing, but disparities remain among smaller member states, delaying full continental reach. The ECB's retail payments strategy emphasises resilience and cyber-security, prerequisites for external connectivity.
The Middle East and Africa present divergent pictures. Gulf Cooperation Council states invest heavily in domestic instant-payment rails, yet data-residency mandates raise operational costs for cloud-based PSPs. Sub-Saharan Africa battles correspondent de-risking, which forces small banks to rely on regional hubs in Johannesburg or Casablanca, inflating fees by up to 200 basis points. The Pan-African Payment and Settlement System (PAPSS) promises intra-African currency clearing, yet liquidity funding remains modest.
South America shows notable innovation through Brazil's Pix, which processed 42 billion transactions in 2023. Regional fintechs embed multi-currency wallets to hedge local inflation, particularly in Argentina. Remitters value stablecoin rails, with 30% of US-Mexico transfers executed via crypto tokens in 2023. However, fragmented regulatory frameworks impede continent-wide interoperability.
Oceania benefits from advanced digital infrastructure and close trade ties with Asia. Australia's New Payments Platform (NPP) delivers real-time domestic payments and is testing PayTo for scheduled obligations. New Zealand's participation in the Trans-Tasman Payment Platform simplifies AUD/NZD clearing, offering a template for broader Pacific connectivity.
- Adyen N.V.
- American Express Company
- Stripe Inc.
- Payoneer Global Inc.
- PayPal Holdings Inc.
- Fidelity National Information Services Inc. (FIS)
- Wise plc
- Western Union Holdings Inc.
- Remitly Global Inc.
- MoneyGram International Inc.
- Visa Inc.
- Mastercard Incorporated
- Ripple Labs Inc.
- Ant Group Co., Ltd. (Alipay)
- Revolut Ltd.
- Worldline SA
- Nium Pte. Ltd.
- Euronet Worldwide Inc.
- Airwallex Pty. Ltd.
- Thunes Singapore Pte. Ltd.
- TerraPay Pte. Ltd.
- JPMorgan Chase and Co. (Liink)
- Square, Inc. (Block)
- Paysafe Group Ltd.
Additional Benefits:
- The market estimate (ME) sheet in Excel format
- 3 months of analyst support
TABLE OF CONTENTS
1 INTRODUCTION
- 1.1 Study Assumptions and Market Definition
- 1.2 Scope of the Study
2 RESEARCH METHODOLOGY
3 EXECUTIVE SUMMARY
4 MARKET LANDSCAPE
- 4.1 Market Overview
- 4.2 Market Drivers
- 4.2.1 Rising B2B E-commerce Export Volumes in Asia
- 4.2.2 Growing Adoption of ISO 20022 Messaging Standards in EU Payment Hubs
- 4.2.3 SWIFT gpi and Instant FX Windows Boosting Same-day Settlement Demand
- 4.2.4 PSD3-Driven Open-Banking APIs Accelerating European Cross-Border P2P
- 4.2.5 Adoption of Multi-Currency Wallets by Gig-Economy Platforms in LATAM
- 4.2.6 Corporate Treasury Shift to Virtual Accounts for Centralised Liquidity
- 4.3 Market Restraints
- 4.3.1 De-Risking by Global Banks Cutting Correspondent Lines in Africa
- 4.3.2 Persistently High FX Mark-ups on Exotic Currency Corridors
- 4.3.3 Fragmented Real-Time Payment Schemes Hindering Interlinking Efforts
- 4.3.4 Data-Residency Rules Limiting Cloud Deployment in MENA
- 4.4 Value Chain Analysis
- 4.5 Regulatory Outlook
- 4.6 Porter's Five Forces
- 4.6.1 Bargaining Power of Suppliers
- 4.6.2 Bargaining Power of Consumers
- 4.6.3 Threat of New Entrants
- 4.6.4 Threat of Substitute Products
- 4.6.5 Intensity of Competitive Rivalry
- 4.7 Assessment of Impact of Macroeconomic Trends
- 4.8 Investment Analysis
5 MARKET SIZE AND GROWTH FORECASTS (VALUES)
- 5.1 By Transaction Type
- 5.1.1 B2B
- 5.1.2 C2C
- 5.1.3 Wholesale
- 5.1.4 Other Transaction Types
- 5.2 By Channel
- 5.2.1 Bank Transfers (SWIFT, ACH, RTP)
- 5.2.2 Cards
- 5.2.3 Money Transfer Operators
- 5.2.4 Other Channels
- 5.3 By Enterprise Size
- 5.3.1 SMEs
- 5.3.2 Large Enterprises
- 5.4 By End-User
- 5.4.1 Business Enterprises
- 5.4.2 Individuals / Consumers
- 5.4.3 Government
- 5.5 By Geography
- 5.5.1 North America
- 5.5.2 Europe
- 5.5.3 Asia Pacific
- 5.5.4 Middle East
- 5.5.5 Africa
- 5.5.6 South America
- 5.5.7 Oceania
6 COMPETITIVE LANDSCAPE
- 6.1 Market Concentration
- 6.2 Strategic Moves
- 6.3 Market Share Analysis
- 6.4 Company Profiles (includes Global-level Overview, Market-level Overview, Core Segments, Financials as available, Strategic Information, Market Rank/Share, Products and Services, Recent Developments)
- 6.4.1 Adyen N.V.
- 6.4.2 American Express Company
- 6.4.3 Stripe Inc.
- 6.4.4 Payoneer Global Inc.
- 6.4.5 PayPal Holdings Inc.
- 6.4.6 Fidelity National Information Services Inc. (FIS)
- 6.4.7 Wise plc
- 6.4.8 Western Union Holdings Inc.
- 6.4.9 Remitly Global Inc.
- 6.4.10 MoneyGram International Inc.
- 6.4.11 Visa Inc.
- 6.4.12 Mastercard Incorporated
- 6.4.13 Ripple Labs Inc.
- 6.4.14 Ant Group Co., Ltd. (Alipay)
- 6.4.15 Revolut Ltd.
- 6.4.16 Worldline SA
- 6.4.17 Nium Pte. Ltd.
- 6.4.18 Euronet Worldwide Inc.
- 6.4.19 Airwallex Pty. Ltd.
- 6.4.20 Thunes Singapore Pte. Ltd.
- 6.4.21 TerraPay Pte. Ltd.
- 6.4.22 JPMorgan Chase and Co. (Liink)
- 6.4.23 Square, Inc. (Block)
- 6.4.24 Paysafe Group Ltd.
7 MARKET OPPORTUNITIES AND FUTURE OUTLOOK
- 7.1 White-Space and Unmet-Need Assessment

