
PUBLISHER: Mordor Intelligence | PRODUCT CODE: 1937433

PUBLISHER: Mordor Intelligence | PRODUCT CODE: 1937433
Agricultural Chelates - Market Share Analysis, Industry Trends & Statistics, Growth Forecasts (2026 - 2031)
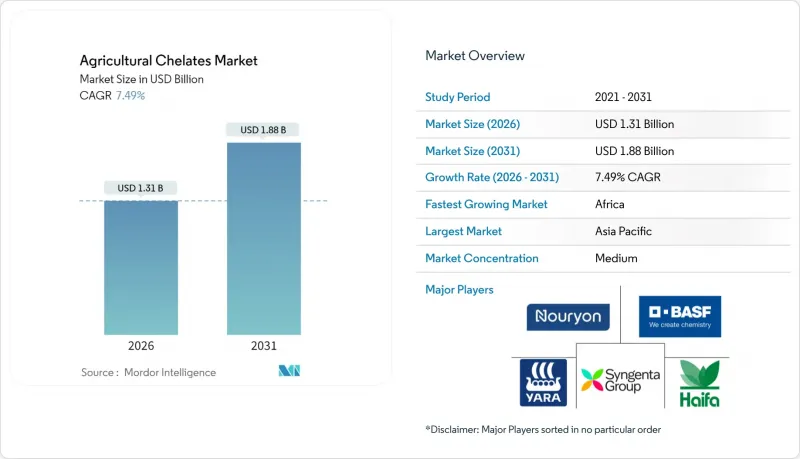
The agricultural chelates market was valued at USD 1.22 billion in 2025 and estimated to grow from USD 1.31 billion in 2026 to reach USD 1.88 billion by 2031, at a CAGR of 7.49% during the forecast period (2026-2031).
The market growth is driven by increasing pressure to improve crop yields from diminishing farmland, growing adoption of precision fertigation systems, and food security requirements. Farmers across major agricultural regions are using controlled-release chelate formulations to address zinc and iron deficiencies, which can reduce yields by up to 50% even with sufficient macronutrient availability. The Food and Agriculture Organization (FAO) projects that land equipped for irrigation will increase by 32 million hectares (11%) by 2050, while harvested irrigated land will expand by 17%. This expansion, especially in developing countries, has increased the emphasis on efficient agricultural nutrient delivery systems. The European Union's stricter discharge limits on EDTA (Ethylenediaminetetraacetic Acid) and the United States' 45Z tax credit for nutrient-efficient fertilizers are driving demand for biodegradable chelates that address both productivity and environmental requirements. These regulatory developments position the agricultural chelates market as an essential component of modern crop nutrition strategies.
Global Agricultural Chelates Market Trends and Insights
Global Food Security and Shrinking Arable Land
According to the Food and Agriculture Organization of the United Nations (FAO), global food demand must increase by 70% by 2050 to feed the projected world population of over 9 billion people, while per-capita arable land continues to decline. In response, agricultural producers are implementing chelated micronutrients to maximize yields on available farmland. Research demonstrates that undetected micronutrient deficiencies can reduce grain yields by 20-50%, even with adequate nitrogen, phosphorus, and potassium levels. Chelates address this issue by maintaining metal solubility across various pH levels. The expansion of greenhouse operations in the United States has increased the demand for high-quality micronutrient solutions, particularly for recirculating hydroponic systems. The combination of limited arable land, population growth, and expanding indoor farming operations continues to drive growth in the agricultural chelates market.
Micronutrient Deficiency in Soil
Soil surveys demonstrate zinc deficiencies in more than 50% of cultivated land and iron deficiencies in approximately 30% of farmland, particularly in alkaline or calcareous soils. In these pH conditions, conventional sulfates frequently precipitate, limiting trace metal availability to plants. Chelated micronutrients maintain their solubility across pH levels from 4 to 9 by protecting metal ions from precipitation. The annual crop losses due to micronutrient deficiencies amount to USD 15-20 billion, substantiating the adoption of chelated products to protect crop yields and quality.
Stringent Regulations on Synthetic Chelating Agents
Environmental regulations on synthetic chelating agents are limiting market growth, particularly affecting traditional EDTA (Ethylenediaminetetraacetic Acid) and DTPA (Diethylenetriaminepentaacetic Acid) formulations due to their environmental persistence and aquatic toxicity. The European Union's REACH dossier classifies EDTA as highly persistent, with soil half-lives exceeding 365 days, and indicates moderate chronic aquatic toxicity. California implemented chelate-specific labeling requirements in 2025, while the Environmental Protection Agency (EPA) guidelines restrict EDTA concentrations in drinking water. As watershed monitoring detects EDTA in runoff at concentrations up to 261 µg/L, manufacturers face increasing compliance costs. These regulatory guidelines reduce sales of synthetic products and constrain growth in the agricultural chelates market.
Other drivers and restraints analyzed in the detailed report include:
- Rising Consumption of Nutritionally Fortified Crops
- Compatibility-Driven Specialty Chelates for Smart Fertigation Systems
- Higher Cost Versus Conventional Micronutrient Salts
For complete list of drivers and restraints, kindly check the Table Of Contents.
Segment Analysis
Synthetic chelates accounted for 64.62% of the agricultural chelates market share in 2025. EDTA (Ethylenediaminetetraacetic Acid) maintains broad metal affinity, while EDDHA (Ethylenediamine-N, N'-bis(2-hydroxyphenylacetic acid)) performs well in alkaline soils. DTPA (Diethylenetriaminepentaacetic Acid) provides strong complexation at neutral pH, making it essential for closed fertigation and hydroponic systems in controlled environment agriculture.
Organic chelates are growing at an 7.78% CAGR, driven by sustainability requirements and increased adoption of lignosulfonate and amino acid complexes from renewable biomass. These market dynamics are projected to transform the agricultural chelates market through 2031, with developments occurring in both synthetic and organic segments. Specialty crop producers are willing to pay higher prices for certified biodegradable chelates to meet eco-label standards and access low-carbon financing. The agricultural chelates market is moving from volume-based competition to environmental performance differentiation, benefiting companies that can produce sustainable alternatives while maintaining stability across pH, temperature, and ionic strength ranges.
The Agricultural Chelates Market Report is Segmented by Type (Synthetic and Organic), by Application (Soil, Foliar, Fertigation, and Other Applications), by Crop Type (Grains and Cereals, Pulses and Oilseeds, Commercial Crops, Fruits and Vegetables, and Turf and Ornamentals), and by Geography (North America, Europe, Asia-Pacific, South America, Middle East, and Africa). The Market Forecasts are Provided in Terms of Value (USD).
Geography Analysis
Asia-Pacific held 33.45% of the agricultural chelates market share in 2025, establishing itself as the primary market for agricultural chelates. China leads the region, driven by national policies that combine sustainable agricultural intensification with water quality regulations. The country's provincial governments offer subsidies for precision fertigation equipment, increasing the demand for stable chelates in closed irrigation systems. India's implementation of the Agri Stack digital voucher platform in 2024 is optimizing micronutrient distribution to small-scale farmers, which is anticipated to increase chelate usage per acre during the forecast period. Japan and Australia maintain consistent premium demand through their advanced greenhouse facilities and export-oriented horticulture.
Africa demonstrates a 9.88% forecast CAGR, driven by donor-supported soil health initiatives and increased focus on addressing nutritional deficiencies. Nigeria's fertilizer program provides concessional loans to chelate distributors serving small-scale farmers, while South African commercial farms implement sensor-guided fertigation to optimize water usage. East African Community members are adopting Kenya's digital extension services model to educate farmers about deficiency identification and chelate application. The combination of multilateral funding, educational initiatives, and supportive policies establishes Africa as the fastest-growing region in the agricultural chelates market.
Europe maintains significant market influence despite its smaller agricultural area, due to high per-hectare input investments and stringent environmental regulations for chelates. The region shows increasing preference for biodegradable options, particularly lignosulfonates and amino acid formulations. The Common Agricultural Policy's investment grants for precision agriculture equipment are driving the adoption of fertigation-specific chelates. The growing organic produce market creates opportunities for plant-based chelation agents that meet certification requirements. These factors help Europe maintain a substantial share in the agricultural chelates market despite limited growth in cultivated area.
- Nouryon Chemicals Holding B.V.
- BASF SE
- Yara International ASA
- Haifa Group
- Syngenta Group (Valagro S.p.A)
- Mitsubishi Chemical Corporation
- BMS Micro-Nutrients NV
- ICL Group Ltd.
- Nufarm Limited
- Protex International
- Shandong IRO Chelating Chemical Co. Ltd.
- Ava Chemicals Private Limited
- Innospec Inc.
- Brandt Consolidated, Inc.
- Shiv Chem Industries
Additional Benefits:
- The market estimate (ME) sheet in Excel format
- 3 months of analyst support
TABLE OF CONTENTS
1 Introduction
- 1.1 Study Assumptions and Market Definition
- 1.2 Scope of the Study
2 Research Methodology
3 Executive Summary
4 Market Landscape
- 4.1 Market Overview
- 4.2 Market Drivers
- 4.2.1 Global Food Security and Shrinking Arable Land
- 4.2.2 Micronutrient Deficiency in Soil
- 4.2.3 Rising Consumption of Nutritionally Fortified Crops
- 4.2.4 Compatibility-Driven Specialty Chelates for Smart Fertigation Systems
- 4.2.5 Carbon-Credit-Linked Nutrient-Use-Efficiency Programs
- 4.2.6 Expansion of Controlled Environment Agriculture
- 4.3 Market Restraints
- 4.3.1 Stringent Regulations on Synthetic Chelating Agents
- 4.3.2 Higher Cost Versus Conventional Micronutrient Salts
- 4.3.3 Limited Awareness Among Smallholder Farmers
- 4.3.4 Competition from Bio-Stimulant Alternatives
- 4.4 Regulatory Landscape
- 4.5 Technological Outlook
- 4.6 Porter's Five Forces Analysis
- 4.6.1 Bargaining Power of Suppliers
- 4.6.2 Bargaining Power of Buyers
- 4.6.3 Threat of New Entrants
- 4.6.4 Threat of Substitutes
- 4.6.5 Intensity of Competitive Rivalry
5 Market Size and Growth Forecasts (Value)
- 5.1 By Type
- 5.1.1 Synthetic
- 5.1.1.1 EDTA (Ethylenediaminetetraacetic Acid)
- 5.1.1.2 EDDHA (Ethylenediamine-N,N'-bis(2-hydroxyphenylacetic acid))
- 5.1.1.3 DTPA (Diethylenetriaminepentaacetic Acid)
- 5.1.1.4 IDHA (Iminodisuccinic Acid)
- 5.1.1.5 Other Synthetic Types (CDTA (Cyclohexane-1,2-diaminetetraacetic Acid), NTA (Nitrilotriacetic Acid), etc.)
- 5.1.2 Organic
- 5.1.2.1 Lignosulfonates
- 5.1.2.2 Amino acids
- 5.1.2.3 Heptagluconates
- 5.1.2.4 Other Organic Types (Citrates, Humic and Fulvic Acid Complexes, etc.)
- 5.1.1 Synthetic
- 5.2 By Application
- 5.2.1 Soil
- 5.2.2 Foliar
- 5.2.3 Fertigation
- 5.2.4 Other Applications (Seed Treatment/Seed Coating, Hydroponics, etc.)
- 5.3 By Crop Type
- 5.3.1 Grains and Cereals
- 5.3.2 Pulses and Oilseeds
- 5.3.3 Commercial Crops
- 5.3.4 Fruits and Vegetables
- 5.3.5 Turfs and Ornamentals
- 5.4 By Geography
- 5.4.1 North America
- 5.4.1.1 United States
- 5.4.1.2 Canada
- 5.4.1.3 Mexico
- 5.4.1.4 Rest of North America
- 5.4.2 Europe
- 5.4.2.1 Spain
- 5.4.2.2 United Kingdom
- 5.4.2.3 France
- 5.4.2.4 Germany
- 5.4.2.5 Russia
- 5.4.2.6 Italy
- 5.4.2.7 Rest of Europe
- 5.4.3 Asia-Pacific
- 5.4.3.1 China
- 5.4.3.2 Japan
- 5.4.3.3 India
- 5.4.3.4 Australia
- 5.4.3.5 Rest of Asia-Pacific
- 5.4.4 South America
- 5.4.4.1 Brazil
- 5.4.4.2 Argentina
- 5.4.4.3 Rest of South America
- 5.4.5 Middle East
- 5.4.5.1 Saudi Arabia
- 5.4.5.2 United Arab Emirates
- 5.4.5.3 Rest of Middle East
- 5.4.6 Africa
- 5.4.6.1 South Africa
- 5.4.6.2 Nigeria
- 5.4.6.3 Rest of Africa
- 5.4.1 North America
6 Competitive Landscape
- 6.1 Market Concentration
- 6.2 Strategic Moves
- 6.3 Market Share Analysis
- 6.4 Company Profiles (Includes Global-level Overview, Market-level Overview, Core Segments, Financials as Available, Strategic Information, Market Rank/Share, Products and Services, and Recent Developments)
- 6.4.1 Nouryon Chemicals Holding B.V.
- 6.4.2 BASF SE
- 6.4.3 Yara International ASA
- 6.4.4 Haifa Group
- 6.4.5 Syngenta Group (Valagro S.p.A)
- 6.4.6 Mitsubishi Chemical Corporation
- 6.4.7 BMS Micro-Nutrients NV
- 6.4.8 ICL Group Ltd.
- 6.4.9 Nufarm Limited
- 6.4.10 Protex International
- 6.4.11 Shandong IRO Chelating Chemical Co. Ltd.
- 6.4.12 Ava Chemicals Private Limited
- 6.4.13 Innospec Inc.
- 6.4.14 Brandt Consolidated, Inc.
- 6.4.15 Shiv Chem Industries
7 Market Opportunities and Future Outlook

