
PUBLISHER: Mordor Intelligence | PRODUCT CODE: 1939586

PUBLISHER: Mordor Intelligence | PRODUCT CODE: 1939586
Europe Biostimulants - Market Share Analysis, Industry Trends & Statistics, Growth Forecasts (2026 - 2031)
Europe biostimulants market size in 2026 is estimated at USD 1.81 billion, growing from 2025 value of USD 1.71 billion with 2031 projections showing USD 2.39 billion, growing at 5.78% CAGR over 2026-2031.
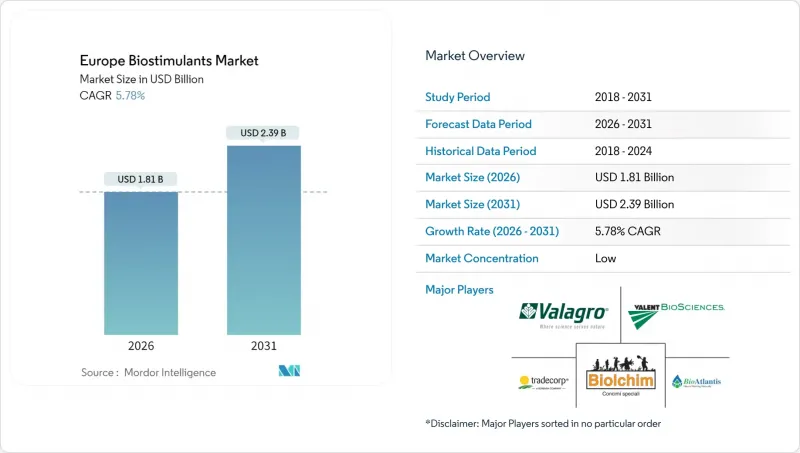
The outlook reflects accelerating policy pressure to curb synthetic fertilizer use, a growing organic acreage base, and widening access to Conformite Europeenne (CE) marked products that streamline cross-border sales. Technology improvements have trimmed seaweed extraction and microbial fermentation costs by up to 20%, bringing biological inputs closer to parity with conventional fertilizers and reinforcing the overall growth trajectory. Precision agriculture adoption continues to validate field-level returns, especially in variable-rate application systems that match biostimulant dosing to crop needs. Competitive intensity remains low, with top five players hold 5.5% share.
Europe Biostimulants Market Trends and Insights
EU Green Deal and Farm-to-Fork Fertilizer-Reduction Mandates
The European Union made its 20% synthetic-fertilizer-cut target legally binding, so every member state must show measurable progress within its national strategic plan. Field pilots in Brittany and Bavaria already record 12-15% substitution when biostimulants are paired with variable-rate spreaders. Cooperative advisers now bundle compliance audits with biological-input recommendations, turning regulation into a commercial pull rather than a push. Equipment vendors and input suppliers co-sponsor on-farm demonstrations that prove yield stability under lower nutrient rates, further easing adoption resistance. As penalty fees escalate from 2026 onward, growers are increasingly locking in multi-year supply contracts for Conformite Europeenne (CE)-marked formulations that help them meet mandated nutrient benchmarks.
Expansion of Certified Organic Farmland
Certified organic acreage expanded by 3.6% per year between 2020 and 2023, reaching 17.7 million hectares, equivalent to 10.1% of total farmland. Organic rules prohibit most synthetic fertilizers, so certified biostimulants fill the nutrient-management gap while supporting plant resilience. Premium farm-gate prices, often 20 to 40% higher than those for conventional crops, offset higher input costs and shorten the payback periods for biological products. Retailers now demand third-party verification of input provenance, which favors manufacturers with transparent supply chains and digital traceability. The trend extends beyond early adopters, such as Austria, to mid-sized producers in Italy and Spain, thereby widening the addressable base for Conformite Europeenne (CE)-certified labels.
Absence of EU-Wide Performance Standards and Protocols
Although Conformite Europeenne (CE) marking simplifies market access, there is still no pan-European benchmark for field-level efficacy, leaving farmers to rely on disparate national trial data. Advisory cooperatives struggle to issue definitive product rankings, so risk-averse growers delay adoption until local case studies accumulate. Low-performing labels can legally coexist with science-backed brands, muddying market signals and eroding trust. Industry associations are pushing for a unified protocol, but consensus remains slow due to the wide variation in climatic zones and crop mixes across Europe. Until harmonization arrives, buyers will lean on peer referral and brand reputation, which lengthens sales cycles.
Other drivers and restraints analyzed in the detailed report include:
- Harmonized Conformite Europeenne (CE)-Mark Framework Streamlining Market Access
- Rapid Cost Declines in Seaweed Extraction and Microbial Fermentation
- Higher Price Premium Versus Conventional Fertilizers
For complete list of drivers and restraints, kindly check the Table Of Contents.
Segment Analysis
Amino acids secured 55.35% of Europe biostimulants market share in 2025, reflecting their versatility across cereals, oilseeds, and greenhouse crops. Humic acid formulations, prized for their carbon-rich soil-conditioning benefits, are predicted to expand at the fastest 6.84% CAGR between 2026 and 2031, outpacing all other categories as regenerative agriculture practices spread. The widening performance gap underscores a shift from purely plant-focused inputs toward solutions that also rebuild soil structure and microbial activity, aligning with subsidy schemes that reward long-term sustainability.
Seaweed extracts continue to anchor certified-organic programs, while fulvic acids gain traction in micronutrient delivery for high-value fruits and vegetables. Protein hydrolysates appeal to specialty growers seeking fast amino-nitrogen uptake under stress, whereas the diverse "other biostimulants" pool including microbial blends and peptide complexes serves niche needs in protected cultivation. Collectively, these offerings broaden the functional palette, allowing distributors to craft crop-specific packages that improve nutrient efficiency, enhance stress resilience, and meet regionally distinct regulatory requirements.
The Europe Biostimulants Market Report is Segmented by Form (Amino Acids, Fulvic Acid, Humic Acid, Protein Hydrolysates, Seaweed Extracts, and Other Biostimulants), Crop Type (Cash Crops, Horticultural Crops, and Row Crops), and Geography (France, Germany, Italy, Netherlands, Russia, Spain, Turkey, United Kingdom, and Rest of Europe). The Market Forecasts are Provided in Terms of Value (USD) and Volume (Metric Tons).
List of Companies Covered in this Report:
- Valagro S.p.A.
- Biolchim S.p.A.
- BioAtlantis Limited
- Tradecorp International Pty Limited
- Valent Biosciences LLC
- Italpollina S.p.A.
- BASF SE
- UPL Limited
- Syngenta AG
- Novozymes A/S
- Haifa Chemicals Ltd.
- Koppert B.V.
- Yara International ASA
- Isagro S.p.A.
- SICIT Group S.p.A.
- OMEX Agriculture Limited
- Humintech GmbH
- Atlantica Agricola S.A.
- Brandt Europe S.L.
- Andermatt Biocontrol AG
Additional Benefits:
- The market estimate (ME) sheet in Excel format
- 3 months of analyst support
TABLE OF CONTENTS
1 INTRODUCTION
- 1.1 Study Assumptions and Market Definition
- 1.2 Scope of the Study
- 1.3 Research Methodology
2 REPORT OFFERS
3 EXECUTIVE SUMMARY AND KEY FINDINGS
4 KEY INDUSTRY TRENDS
- 4.1 Area Under Organic Cultivation
- 4.2 Per Capita Spending On Organic Products
- 4.3 Regulatory Framework
- 4.3.1 France
- 4.3.2 Germany
- 4.3.3 Italy
- 4.3.4 Netherlands
- 4.3.5 Russia
- 4.3.6 Spain
- 4.3.7 Turkey
- 4.3.8 United Kingdom
- 4.4 Value Chain and Distribution Channel Analysis
- 4.5 Market Drivers
- 4.5.1 EU Green Deal and Farm-to-Fork Fertilizer-Reduction Mandates
- 4.5.2 Expansion of Certified Organic Farmland
- 4.5.3 Harmonized CE-Mark Framework Streamlining Market Access
- 4.5.4 Rapid Cost Declines in Seaweed Extraction and Microbial Fermentation
- 4.5.5 Precision-ag variable-rate tech proving field-level ROI
- 4.5.6 Surge in EU protein-crop R&D funding driving yield-boost demand
- 4.6 Market Restraints
- 4.6.1 Absence of EU-Wide Performance Standards and Protocols
- 4.6.2 Higher Price Premium Versus Conventional Fertilizers
- 4.6.3 Seaweed biomass supply volatility in Atlantic & Baltic aquaculture
- 4.6.4 Digital labeling / traceability compliance costs post-2024
5 MARKET SIZE AND GROWTH FORECASTS (VALUE AND VOLUME)
- 5.1 Form
- 5.1.1 Amino Acids
- 5.1.2 Fulvic Acid
- 5.1.3 Humic Acid
- 5.1.4 Protein Hydrolysates
- 5.1.5 Seaweed Extracts
- 5.1.6 Other Biostimulants
- 5.2 Crop Type
- 5.2.1 Cash Crops
- 5.2.2 Horticultural Crops
- 5.2.3 Row Crops
- 5.3 Country
- 5.3.1 France
- 5.3.2 Germany
- 5.3.3 Italy
- 5.3.4 Netherlands
- 5.3.5 Russia
- 5.3.6 Spain
- 5.3.7 Turkey
- 5.3.8 United Kingdom
- 5.3.9 Rest of Europe
6 COMPETITIVE LANDSCAPE
- 6.1 Key Strategic Moves
- 6.2 Market Share Analysis
- 6.3 Company Landscape
- 6.4 Company Profiles (includes Global Level Overview, Market Level Overview, Core Business Segments, Financials, Headcount, Key Information, Market Rank, Market Share, Products and Services, and Analysis of Recent Developments).
- 6.4.1 Valagro S.p.A.
- 6.4.2 Biolchim S.p.A.
- 6.4.3 BioAtlantis Limited
- 6.4.4 Tradecorp International Pty Limited
- 6.4.5 Valent Biosciences LLC
- 6.4.6 Italpollina S.p.A.
- 6.4.7 BASF SE
- 6.4.8 UPL Limited
- 6.4.9 Syngenta AG
- 6.4.10 Novozymes A/S
- 6.4.11 Haifa Chemicals Ltd.
- 6.4.12 Koppert B.V.
- 6.4.13 Yara International ASA
- 6.4.14 Isagro S.p.A.
- 6.4.15 SICIT Group S.p.A.
- 6.4.16 OMEX Agriculture Limited
- 6.4.17 Humintech GmbH
- 6.4.18 Atlantica Agricola S.A.
- 6.4.19 Brandt Europe S.L.
- 6.4.20 Andermatt Biocontrol AG
7 KEY STRATEGIC QUESTIONS FOR AGRICULTURAL BIOLOGICALS CEOS

