
PUBLISHER: Mordor Intelligence | PRODUCT CODE: 1940657

PUBLISHER: Mordor Intelligence | PRODUCT CODE: 1940657
Asia Pacific Media And Entertainment - Market Share Analysis, Industry Trends & Statistics, Growth Forecasts (2026 - 2031)
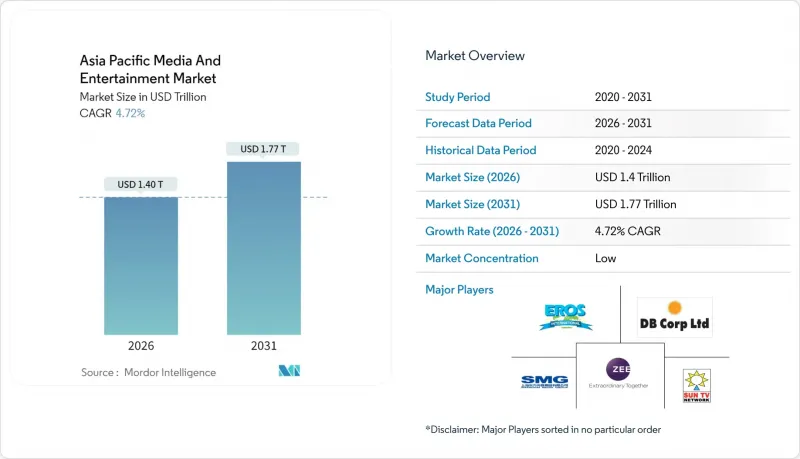
The Asia Pacific media entertainment market was valued at USD 1,340 billion in 2025 and estimated to grow from USD 1,403.25 billion in 2026 to reach USD 1,767.01 billion by 2031, at a CAGR of 4.72% during the forecast period (2026-2031).
Mobile-first habits, accelerating 5G rollouts, and localized streaming libraries are steering consumer time and advertiser spend toward digital channels, placing pressure on legacy television and print formats. Gaming platforms benefit from the region's youthful demographic and smartphone ubiquity, while subscription video services gain traction through regional-language content that boosts stickiness and curbs churn. Advertisers are shifting budget toward programmatic video and connected-TV placements that deliver measurable outcomes, prompting broadcasters to bundle ad-supported tiers with premium packages. Consolidation among studios and distributors signals a pivot from geographic expansion toward vertical integration as firms seek end-to-end control of creation, curation, and monetization.
Asia Pacific Media And Entertainment Market Trends and Insights
Rising Smartphone Penetration and Cheap Data
Mobile internet penetration reached 51% region-wide in 2024, nearly triple the 2014 base, with the mobile sector adding USD 880 billion to regional GDP. Indonesia illustrates the shift: online video's share of total screen time climbed from 34% in 2020 to 50% in 2023, while premium video-on-demand household penetration doubled to 7%. Subscription video-on-demand has overtaken pay-TV, enabling creators to bypass legacy distributors and monetize through micro-transactions and social commerce tie-ins. Cheap data drives short-form content virality, bolstering influencer-led marketing and live-commerce revenues.
Surging OTT Investment in Regional-Language Content
Netflix generated USD 1.8 billion in Southeast Asia streaming revenue during 2025 by prioritizing regional-language production. Korean shows claim 30% of premium VOD viewership region-wide. In India, regional OTT titles surpassed Hindi programs for the first time in 2023, underscoring the commercial pull of hyper-localized storytelling. Chinese dramas posted 43% global view growth on iQiyi, signaling strong international appetite for culturally specific narratives. Platforms that invest in authentic local voices enjoy higher engagement, lower churn, and better algorithmic discovery.
Endemic Digital Piracy and Content Leakage
Digital piracy rose from 52% of online users in 2023 to 59% in 2024, peaking at 71% in Vietnam and 70% in the Philippines. Social networks and messaging apps recorded a 14% increase as channels for illicit sharing. Global losses may hit USD 75 billion in 2025, eroding studio cash flow and curbing R&D investment. Site-blocking orders have curtailed traffic in Indonesia, Singapore, and Malaysia; Indonesia's IP authority earned an Interpol award for enforcement success. Persistent leakage elevates compliance costs and complicates windowing strategies.
Other drivers and restraints analyzed in the detailed report include:
- Expansion of 5G-Fuelled E-Sports and Cloud Gaming
- Shift of Ad Spend from TV to Digital Performance Channels
- Fragmented Cross-Border Regulatory Regimes
For complete list of drivers and restraints, kindly check the Table Of Contents.
Segment Analysis
Video games and e-sports captured 20.72% of the Asia Pacific media entertainment market share in 2025. China generated USD 60.59 billion in gaming revenue, outstripping the United States, largely through mobile hits and e-sports leagues that drive merchandise and media rights sales. The Asia Pacific media entertainment market size for gaming is projected to expand steadily as 5G and cloud offload hardware costs for casual gamers. Tencent and NetEase sit on USD 61.03 billion in cash reserves, giving them ample firepower for acquisitions and IP licensing deals.
OTT video, although smaller, is growing fastest at a 6.02% CAGR to 2031. India's SVoD revenues are forecast to hit USD 2.1 billion by 2028 after a 6.7% CAGR lift from 2023. Local-language originals and lower-tier pricing undercut churn, improving lifetime value. Traditional television and publishing segments continue to cede share as audiences migrate to on-demand screens, yet live events and experiential formats retain appeal through hybrid digital-physical models.
The Asia Pacific Media and Entertainment Market Report is Segmented by Content Type (Filmed Entertainment, Television, Music and Audio Streaming, and More), Platform (Cable and Satellite, Cinema Screens, and More), Revenue Stream (Advertising, Subscription, and More), and Geography. The Market Forecasts are Provided in Terms of Value (USD).
List of Companies Covered in this Report:
- Tencent Holdings Ltd.
- Sony Group Corporation
- ByteDance Ltd.
- The Walt Disney Company
- Netflix Inc.
- Amazon.com Inc.
- Zee Entertainment Enterprises Ltd.
- Sun TV Network Ltd.
- Dish TV India Ltd.
- Eros International Media Ltd.
- China Media Group Co. Ltd.
- Shanghai Media and Entertainment Group Co. Ltd.
- China Film Group Corporation
- Shanghai Animation Film Studio (Shanghai Film Group Corp.)
- DB Corp Ltd.
- HT Media Ltd.
- BlueFocus Communication Group Co. Ltd.
- CJ ENM Co. Ltd.
- Kakao Entertainment Corp.
- PT Media Nusantara Citra Tbk
- Nine Entertainment Co. Holdings Ltd.
- Sky Network Television Ltd.
- NHK (Japan Broadcasting Corporation)
Additional Benefits:
- The market estimate (ME) sheet in Excel format
- 3 months of analyst support
TABLE OF CONTENTS
1 INTRODUCTION
- 1.1 Study Assumptions and Market Definition
- 1.2 Scope of the Study
2 RESEARCH METHODOLOGY
3 EXECUTIVE SUMMARY
4 MARKET LANDSCAPE
- 4.1 Market Overview
- 4.2 Market Drivers
- 4.2.1 Rising smartphone penetration and cheap data
- 4.2.2 Surging OTT investment in regional-language content
- 4.2.3 Expansion of 5G-fuelled e-sports and cloud gaming
- 4.2.4 Shift of ad spend from TV to digital performance channels
- 4.2.5 Virtual-influencer economy unlocking new revenue
- 4.2.6 State-backed pan-Asia co-production funds
- 4.3 Market Restraints
- 4.3.1 Endemic digital piracy and content leakage
- 4.3.2 Fragmented cross-border regulatory regimes
- 4.3.3 Escalating VFX/animation talent costs
- 4.3.4 Deep-fake and brand-safety concerns
- 4.4 Regulatory Landscape
- 4.5 Technological Outlook
- 4.6 Porter's Five Forces Analysis
- 4.6.1 Bargaining Power of Suppliers
- 4.6.2 Bargaining Power of Consumers
- 4.6.3 Threat of New Entrants
- 4.6.4 Threat of Substitutes
- 4.6.5 Intensity of Competitive Rivalry
- 4.7 Impacts of Macro Trends
- 4.8 Investment Analysis
5 MARKET SIZE AND GROWTH FORECASTS (VALUE)
- 5.1 By Content Type
- 5.1.1 Filmed Entertainment
- 5.1.2 Television
- 5.1.3 Music and Audio Streaming
- 5.1.4 Publishing (Books, Magazines, Newspapers)
- 5.1.5 Video Games and e-Sports
- 5.1.6 OTT Video
- 5.1.7 Live and Experiential Entertainment
- 5.2 By Platform
- 5.2.1 Cable and Satellite
- 5.2.2 Cinema Screens
- 5.2.3 Online/Desktop
- 5.2.4 Mobile
- 5.2.5 Smart-TV and Connected Devices
- 5.3 By Revenue Stream
- 5.3.1 Advertising
- 5.3.2 Subscription
- 5.3.3 Pay-per-view / Transactional
- 5.3.4 Licensing and Merchandising
- 5.3.5 Box-office and Ticketing
- 5.4 By Country
- 5.4.1 China
- 5.4.2 India
- 5.4.3 Japan
- 5.4.4 South Korea
- 5.4.5 Australia
- 5.4.6 Indonesia
- 5.4.7 Thailand
- 5.4.8 Malaysia
- 5.4.9 Singapore
- 5.4.10 Vietnam
- 5.4.11 Other Countries
6 COMPETITIVE LANDSCAPE
- 6.1 Market Concentration
- 6.2 Strategic Moves
- 6.3 Market Share Analysis
- 6.4 Company Profiles (includes Global level Overview, Market level overview, Core Segments, Financials as available, Strategic Information, Market Rank/Share for key companies, Products and Services, and Recent Developments)
- 6.4.1 Tencent Holdings Ltd.
- 6.4.2 Sony Group Corporation
- 6.4.3 ByteDance Ltd.
- 6.4.4 The Walt Disney Company
- 6.4.5 Netflix Inc.
- 6.4.6 Amazon.com Inc.
- 6.4.7 Zee Entertainment Enterprises Ltd.
- 6.4.8 Sun TV Network Ltd.
- 6.4.9 Dish TV India Ltd.
- 6.4.10 Eros International Media Ltd.
- 6.4.11 China Media Group Co. Ltd.
- 6.4.12 Shanghai Media and Entertainment Group Co. Ltd.
- 6.4.13 China Film Group Corporation
- 6.4.14 Shanghai Animation Film Studio (Shanghai Film Group Corp.)
- 6.4.15 DB Corp Ltd.
- 6.4.16 HT Media Ltd.
- 6.4.17 BlueFocus Communication Group Co. Ltd.
- 6.4.18 CJ ENM Co. Ltd.
- 6.4.19 Kakao Entertainment Corp.
- 6.4.20 PT Media Nusantara Citra Tbk
- 6.4.21 Nine Entertainment Co. Holdings Ltd.
- 6.4.22 Sky Network Television Ltd.
- 6.4.23 NHK (Japan Broadcasting Corporation)
7 MARKET OPPORTUNITIES AND FUTURE OUTLOOK
- 7.1 White-space and Unmet-Need Assessment

