
PUBLISHER: Mordor Intelligence | PRODUCT CODE: 1940712

PUBLISHER: Mordor Intelligence | PRODUCT CODE: 1940712
Europe Coworking Spaces - Market Share Analysis, Industry Trends & Statistics, Growth Forecasts (2026 - 2031)
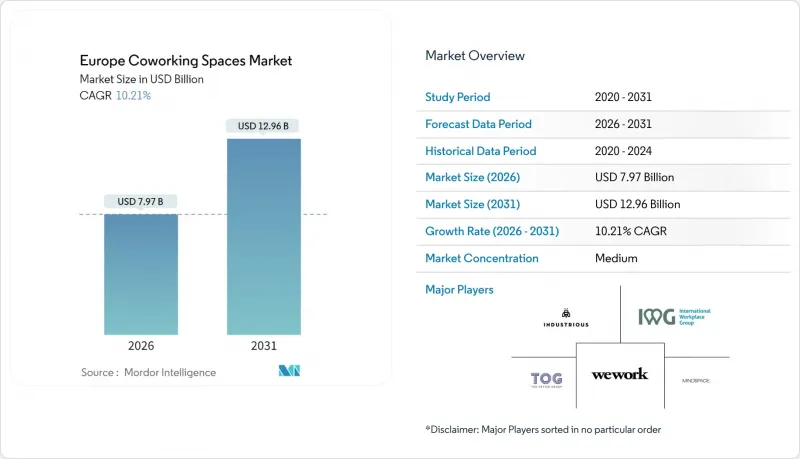
The Europe Co-Working Spaces Market was valued at USD 7.23 billion in 2025 and estimated to grow from USD 7.97 billion in 2026 to reach USD 12.96 billion by 2031, at a CAGR of 10.21% during the forecast period (2026-2031).
Structural shifts toward hybrid work, mounting pressure to optimize corporate real-estate portfolios, and municipal incentives that lower set-up costs are driving sustained demand for flexible workspace solutions. Corporations are embracing asset-light managed agreements to conserve capital, while medium facilities provide the density operators need to balance utilization and service quality. Large sites are scaling fastest as enterprise clients ask for entire floors equipped with private collaboration zones, and AI-enabled utilization platforms are boosting operator margins by providing real-time occupancy data that supports dynamic pricing. At the same time, surplus grey-lease inventory in Tier-1 cities and rising ESG retrofitting costs on aging office stock temper near-term pricing power. Operators that combine technology differentiation with mixed-use location strategies are positioned to capitalize on the next growth phase of the Europe co-working spaces market.
Europe Coworking Spaces Market Trends and Insights
Corporate Real-Estate Portfolio Optimization via Flex Space
Enterprises accelerated their migration to flexible space once refinancing risk resurfaced in the commercial debt market. Asset-light deals now dominate: 95% of IWG's 624 openings in 2024 were structured as managed partnerships that shift cap-ex to landlords while delivering turnkey office ecosystems to corporate tenants. Multinationals treat flexible hubs as part of a networked real-estate stack that reallocates headcount across fewer fixed leases, helping real-estate directors hit 20% seat-density targets without breaching labor-code mandates on square footage per employee. Space-booking APIs integrate with company HR systems so staff reserve desks near project teams on in-office days, enabling firms to reduce square footage per employee by 35% relative to 2019 benchmarks. The most pronounced uptake is in London and Munich, where lenders estimate offices make up 44% of the USD 92.9 billion debt-funding gap due 2025-2027. Flexible space mitigates lease liabilities while sustaining talent-attraction metrics that matter in tight labor markets.
Acceleration of Hybrid Work Policies in EU Labor Codes
EU-level guidance on home-office rights filtered into national statutes during 2024-2025, codifying employee entitlements to remote scheduling and ergonomically safe satellite offices. Employers must now provide "suitable facilities" within commuting distance or grant allowances that cover co-working subscriptions. The mandate shifts compliance costs to companies ill-equipped to track building certifications, prompting procurement teams to outsource the entire workplace bundle to specialized operators. As a result, subscription models, multi-site passes that let staff choose locations daily, gained 32% more corporate seats during 2025 than the prior year. Operators respond by rehabbing legacy inventory to meet ISO 45001 health-and-safety standards, embedding acoustic dampening and air-quality sensors that satisfy labor-inspection audits. Hybrid policies also drive design changes such as team-based neighborhoods and meeting-heavy floorplates so firms can orchestrate anchor days that concentrate collaboration while respecting density caps.
Rising ESG Retrofitting Costs for Aging Office Stock
Europe's 2030 energy-performance mandate requires commercial floor space to achieve EPC B or equivalent, pushing capital expenditure on dated assets skyward. Average retrofit costs for 1970s-era buildings exceed USD 190 per square foot when factoring in electrified HVAC, LED lighting, and facade insulation. Co-working operators that hold management contracts rather than leases avoid direct cap-ex yet still confront service-charge increases passed through by landlords. Tenants from regulated industries now demand BREEAM Very Good or LEED Gold ratings before signing multi-year agreements, effectively rendering non-compliant space unlettable. Financing hurdles intensify in secondary markets where capital-stack structures rely on bank debt priced off floating-rate benchmarks. Operators that anticipate retrofit schedules and negotiate green-certification cap-ex sharing clauses secure a cost advantage, while laggards face stranded-asset risk that can stall network expansion within the Europe co-working spaces market.
Other drivers and restraints analyzed in the detailed report include:
- Booming Startup Ecosystem Seeking Cost-Efficient, Flexible Leases
- National & Municipal Incentives for Revitalizing Post-Pandemic CBDs
- Surplus Grey-Lease Inventory Depressing Desk Rates in Tier-1 Cities
For complete list of drivers and restraints, kindly check the Table Of Contents.
Segment Analysis
Medium facilities, 20,000 to 40,000 square feet, held 52.80% of Europe's co-working spaces market share in 2025, reflecting their ability to support 300-to-500 desk networks without diluting community engagement. Operators use modular partitions to pivot layouts within 48 hours, meeting fluctuating corporate requirements. Large facilities are projected to grow at an 11.74% CAGR through 2031 as enterprises commit to entire floors and demand premium amenities such as broadcast studios and 5G-enabled immersive rooms. Operators balance the higher fixed costs of large footprints by integrating AI-driven space-utilization tools that lift seat density by 18% on event days, smoothing revenue seasonality. Small facilities thrive in commuter belts, acting as spokes in hub-and-spoke models that guarantee members a seat within 20 minutes of home.
A surge in managed agreements, 95% of IWG openings in 2024, signals that landlords prefer partnership models that stabilize cash flows while enabling them to satisfy lender covenants on occupancy. In large facilities, corporate suites account for 42% of gross leased area versus 26% two years earlier, underscoring the shift from freelancer-centric to enterprise-oriented layouts. Duration metrics mirror this shift: the average enterprise contract length rose from nine to 14 months between 2023 and 2025. These dynamics solidify the central role of medium and large sites in accelerating the Europe co-working spaces market.
The Europe Co-Working Spaces Market Report is Segmented by Size & Scale of Facility (Small, Medium, Large), by Sector (Information Technology, BFSI, Business Consulting & Professional Service, Other Services), by End Use (Freelancers, Enterprises, Start Ups and Others), and by Geography (Germany, United Kingdom, France, Italy, Spain, Rest of Europe). The Market Forecasts are Provided in Terms of Value (USD).
List of Companies Covered in this Report:
- IWG (Regus & Spaces)
- WeWork
- The Office Group (TOG)
- Mindspace
- Industrious
- Second Home
- Tribes
- Impact Hub
- Fora Space
- Talent Garden
- Huckletree
- Betahaus
- Knotel Europe
- KAPTUR
- BounceSpace
- Mokrin House
- Paper Hub
- Mortimer House
- Sirius Facilities
Additional Benefits:
- The market estimate (ME) sheet in Excel format
- 3 months of analyst support
TABLE OF CONTENTS
1 Introduction
- 1.1 Study Assumptions & Market Definition
- 1.2 Scope of the Study
2 Research Methodology
3 Executive Summary
4 Market Landscape
- 4.1 Market Overview
- 4.2 Market Drivers
- 4.2.1 Booming startup ecosystem seeking cost-efficient, flexible leases
- 4.2.2 Corporate real-estate (CRE) portfolio optimisation via flex space
- 4.2.3 National & municipal incentives for revitalising post-pandemic CBDs
- 4.2.4 Acceleration of hybrid work policies in EU labour codes (2025+)
- 4.2.5 Venture-capital funding earmarked for "work-near-home" sub-urb hubs
- 4.2.6 AI-enabled space-utilisation platforms boosting operator margins
- 4.3 Market Restraints
- 4.3.1 Surplus grey-lease inventory depressing desk-rates in Tier-1 cities
- 4.3.2 Rising ESG retrofitting costs for ageing office stock
- 4.3.3 Interest-rate volatility constraining REIT financing windows
- 4.3.4 Municipal resistance to zoning conversion in heritage districts
- 4.4 Government Regulations and Initiatives in the Industry
- 4.5 Technological Innovations in the Co-Working Office Space Real Estate Market
- 4.6 Insights into the Key Office Real Estate Industry Metrics (Supply, Rentals, Prices, Occupancy/Vacancy (%))
- 4.7 Impact of Remote Working on Space Demand
- 4.8 Industry Attractiveness - Porter's Five Forces Analysis
- 4.8.1 Threat of New Entrants
- 4.8.2 Bargaining Power of Buyers/Consumers
- 4.8.3 Bargaining Power of Suppliers
- 4.8.4 Threat of Substitute Products
- 4.8.5 Intensity of Competitive Rivalry
5 Market Size & Growth Forecasts (Value, In USD Billion)
- 5.1 By Size & Scale of Facility
- 5.1.1 Small
- 5.1.2 Medium
- 5.1.3 Large
- 5.2 By Sector
- 5.2.1 Information Technology (IT and ITES)
- 5.2.2 BFSI (Banking, Financial Services and Insurance)
- 5.2.3 Business Consulting & Professional Service
- 5.2.4 Other Services (Retail, Lifesciences, Energy, Legal Services)
- 5.3 By End User
- 5.3.1 Freelancers
- 5.3.2 Enterprises
- 5.3.3 Start Ups and Others
- 5.4 By Geography
- 5.4.1 Germany
- 5.4.2 United Kingdom
- 5.4.3 France
- 5.4.4 Italy
- 5.4.5 Spain
- 5.4.6 Rest of Europe
6 Competitive Landscape
- 6.1 Market Concentration
- 6.2 Strategic Moves
- 6.3 Market Share Analysis
- 6.4 Company Profiles (includes Global level Overview, Market level overview, Core Segments, Financials as available, Strategic Information, Products & Services, and Recent Developments)
- 6.4.1 IWG (Regus & Spaces)
- 6.4.2 WeWork
- 6.4.3 The Office Group (TOG)
- 6.4.4 Mindspace
- 6.4.5 Industrious
- 6.4.6 Second Home
- 6.4.7 Tribes
- 6.4.8 Impact Hub
- 6.4.9 Fora Space
- 6.4.10 Talent Garden
- 6.4.11 Huckletree
- 6.4.12 Betahaus
- 6.4.13 Knotel Europe
- 6.4.14 KAPTUR
- 6.4.15 BounceSpace
- 6.4.16 Mokrin House
- 6.4.17 Paper Hub
- 6.4.18 Mortimer House
- 6.4.19 Sirius Facilities
7 Market Opportunities & Future Outlook
- 7.1 White-space & Unmet-Need Assessment

