
PUBLISHER: Mordor Intelligence | PRODUCT CODE: 1940860

PUBLISHER: Mordor Intelligence | PRODUCT CODE: 1940860
Cooling Tower - Market Share Analysis, Industry Trends & Statistics, Growth Forecasts (2026 - 2031)
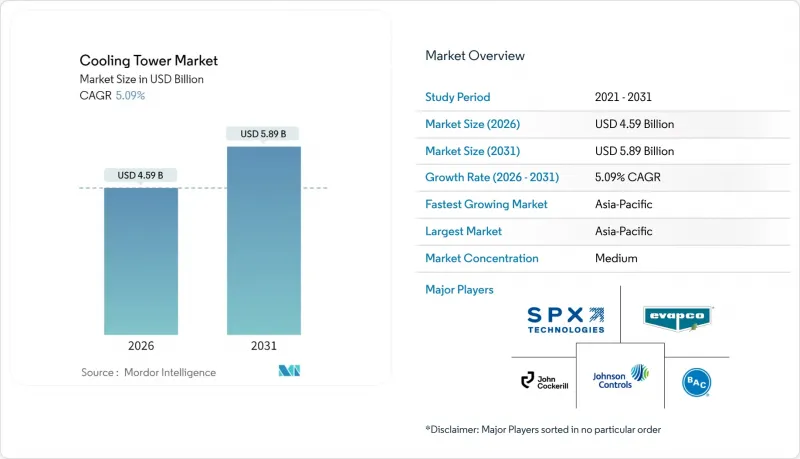
Cooling Tower Market size in 2026 is estimated at USD 4.59 billion, growing from 2025 value of USD 4.37 billion with 2031 projections showing USD 5.89 billion, growing at 5.09% CAGR over 2026-2031.
Continued capital formation in power generation and the build-out of hyperscale data-center campuses keep high-capacity evaporative systems in demand, while hybrid wet-dry designs scale faster as operators react to tightening water-use and energy-efficiency regulations. The accelerated adoption of counter-flow configurations, growth in installations exceeding 20 MW, and the shift to PFAS-free fill materials further reinforce the cooling tower market's growth trajectory. Suppliers capable of integrating digital twin analytics, predictive maintenance, and alternative make-up-water schemes hold an execution edge as sustainability mandates intensify.
Global Cooling Tower Market Trends and Insights
Expanding HVACR Installations in Commercial Real-Estate
The rapid commercialization of mixed-use complexes and high-specification data centers is driving developers toward higher-capacity, digitally monitored evaporative and hybrid systems. Johnson Controls reported a USD 13.1 billion order backlog as smart-building owners specify cooling towers equipped with demand-responsive controls that synchronize with building automation servers. The integration of IoT sensors enables predictive maintenance routines that reduce downtime. Projects in water-stressed localities are increasingly selecting hybrid wet-dry units to meet compliance thresholds without compromising load-following capability. Suppliers that can validate real-world energy savings through CTI-certified performance testing gain a procurement advantage when property investors audit sustainability metrics.
Power Plant Capacity Additions in Asia and Middle East
Utilities in China, India, and the Gulf states are scaling nuclear, gas-fired, and renewable-hybrid plants that require high-capacity counter-flow towers to manage variable steam loads. China's Heqi-1 industrial steam linkage delivers 4.8 million tonnes of process steam annually, underscoring the commercial benefits of integrating cooling towers into industrial heat-recovery loops. GCC utilities adopt seawater-cooled towers at coastal Combined Cycle Gas Turbine sites, reducing freshwater withdrawal and enabling capacity factors above 40% in extreme ambient temperatures. The Middle East's move toward solar-thermal augmentation further positions hybrid systems as compliance-ready for future carbon pricing schemes.
High Operating Cost and Water-Scarcity Concerns
The total cost of ownership is rising because chemical conditioning and discharge fees now exceed electricity costs in many arid markets. Pacific Northwest National Laboratory case studies show that military installations are lowering makeup water demand by recovering HVAC condensate and rainwater; however, capital outlays for integrated storage push payback periods beyond five years. Facilities in Australia and the Middle East, where water charges exceed USD 5 per 1,000 gallons, are increasingly justifying dry cooling or hybrid designs despite efficiency penalties. Suppliers that bundle performance guarantees with water-saving retrofits secure longer-term service contracts that smooth revenue volatility during new-build lulls.
Other drivers and restraints analyzed in the detailed report include:
- Stringent Water-Use and Energy-Efficiency Mandates
- Rapid Build-Out of Hyperscale Data-Center Campuses
- PFAS-Fill Material Phase-Out Increasing Retrofit Demand
For complete list of drivers and restraints, kindly check the Table Of Contents.
Segment Analysis
Counter-flow installations captured 43.10% of the revenue in 2025 and are growing at a 7.69% CAGR, as data-center and pharmaceutical clients prioritize high L/G ratios and smaller footprints. Industrial heat-pump projects that couple counter-flow towers with process chillers deliver annual energy savings of over 15%, directly improving OPEX sensitivity in food & beverage plants. Cross-flow towers retain an installed-base advantage, particularly at coal and gas turbines, where low static-pressure drops ease auxiliary load. However, their share is expected to erode as water tariff escalators favor a more stringent approach to temperature control. Digital twin simulations confirm that counter-flow designs can cut operating cost by 5% when integrated with predictive reservoir management, further propelling share gains.
Legacy cross-flow units remain attractive for retrofit because fill packs are more accessible, and large surface areas accommodate fouling without immediate performance loss. Owners pursuing phased compliance strategies often refurbish cross-flow cells with low-drift eliminators to postpone capital replacement. Even so, new industrial complexes in Southeast Asia are standardizing counter-flow towers sized for a design wet-bulb depression of more than 10 °C, signaling a structural pivot that will reshape manufacturer product portfolios over the decade.
Hybrid wet-dry models are advancing at an 8.34% CAGR, outpacing evaporative towers, which are expected to hold a 66.40% share in 2025. Utilities in water-stressed areas appreciate hybrid designs that switch to dry mode during drought restrictions, maintaining thermal compliance while cutting seasonal water draw by 50%. Field trials of perforated dew-point indirect evaporative modules confirm that supply-air ratios below 0.5 achieve optimal thermal efficiency gains, positioning hybrids as viable replacements for plume-abatement retrofits.
Evaporative towers dominate high-capacity applications because wet operation achieves approach temperatures within 3 °C of the wet-bulb temperature, which is crucial for steam-cycle efficiency. Suppliers hedge market risk by launching modular hybrid lines that retrofit onto evaporative basins, effectively transforming legacy assets. Material advances such as hydrophilic membrane fill promise to push hybrid outlet temperatures closer to wet operation benchmarks, intensifying competition for urban hospitals and semiconductor fabs where plume mitigation is non-negotiable.
The Cooling Tower Market Report is Segmented by Flow Type (Cross-Flow and Counter-Flow), Tower Type (Evaporative, Dry, and Hybrid), Capacity Range (Below 5 MW, 5 To 20 MW, and Above 20 MW), Application (Oil and Gas, Chemical and Petrochemical, Power Generation, HVACR, Data Centers, Pulp and Paper, Food and Beverage, and Others), and Geography (North America, Europe, Asia Pacific, South America, and Middle East and Africa).
Geography Analysis
The Asia-Pacific region commands 43.70% of the cooling tower market and is expected to grow at a 6.78% CAGR, driven by synchronized investments in power, petrochemical, and data center infrastructure across China and India. China's nuclear-steam cogeneration model exemplifies the region's integrated approach, combining industrial decarbonization targets with process heat optimization. India's thermal power refurbishments increasingly specify hybrid towers to conform with draft national water norms that cap withdrawal intensity.
North America registers demand primarily from data-center expansions clustered in Virginia, Texas, and the Pacific Northwest, paired with refinery retrofits to remove PFAS-based fill. Stringent ASHRAE and EPA guidelines further shape procurement toward CTI-certified, low-drift cells. Europe sustains moderate growth as district energy schemes in Germany and Scandinavia adopt hybrid wet-dry towers to balance water stewardship and seasonal load variation. The Middle East and Africa are witnessing a rising uptake of seawater and dry towers attached to solar-thermal and desalination complexes, where freshwater scarcity commands a premium on zero-discharge cycles. South American momentum concentrates in Brazil's mining corridors and Argentina's soy-crushing hubs, both leaning on >20 MW counter-flow towers to handle high dust and variable loading. Collectively, these regional dynamics validate the cooling tower market's resilience across climatic and regulatory mosaics.
- SPX Technologies, Inc.
- Baltimore Aircoil Company, Inc.
- EVAPCO, Inc.
- Johnson Controls International plc
- Hamon and CIE (John Cockerill SA)
- Brentwood Industries, Inc.
- Babcock and Wilcox Enterprises, Inc.
- ENEXIO Management GmbH
- Thermax Ltd.
- Artech Cooling Towers Pvt. Ltd.
- Kelvion Holding GmbH
- Paharpur Cooling Towers Ltd.
- Liang Chi Industry Co., Ltd.
- Star Cooling Towers Pvt. Ltd.
- Delta Cooling Towers, Inc.
- Reymsa Cooling Towers, Inc.
- SPIG S.p.A (BandW)
- Kimre, Inc.
- Mesan Group
Additional Benefits:
- The market estimate (ME) sheet in Excel format
- 3 months of analyst support
TABLE OF CONTENTS
1 Introduction
- 1.1 Study Assumptions & Market Definition
- 1.2 Scope of the Study
2 Research Methodology
3 Executive Summary
4 Market Landscape
- 4.1 Market Overview
- 4.2 Market Drivers
- 4.2.1 Expanding HVACR installations in commercial real-estate
- 4.2.2 Power?plant capacity additions in Asia and Middle East
- 4.2.3 Stringent water-use and energy-efficiency mandates (CTI, ASHRAE)
- 4.2.4 Industrialization and refinery upgrades in emerging economies
- 4.2.5 Rapid build-out of hyperscale data-center campuses
- 4.2.6 Green hydrogen electrolyzer projects needing process cooling
- 4.3 Market Restraints
- 4.3.1 High operating cost and water?scarcity concerns
- 4.3.2 Plume-abatement/drift-elimination compliance costs
- 4.3.3 Shift toward adiabatic dry coolers in below 1 MW range
- 4.3.4 PFAS-fill material phase-out increasing retrofit over new build
- 4.4 Supply-Chain Analysis
- 4.5 Regulatory Landscape
- 4.6 Technological Outlook
- 4.7 Porter's Five Forces
- 4.7.1 Bargaining Power of Suppliers
- 4.7.2 Bargaining Power of Consumers
- 4.7.3 Threat of New Entrants
- 4.7.4 Threat of Substitutes
- 4.7.5 Intensity of Competitive Rivalry
5 Market Size & Growth Forecasts
- 5.1 By Flow Type
- 5.1.1 Cross-Flow
- 5.1.2 Counter-Flow
- 5.2 By Tower Type
- 5.2.1 Evaporative
- 5.2.2 Dry
- 5.2.3 Hybrid (Wet-Dry)
- 5.3 By Capacity Range
- 5.3.1 Below 5 MW
- 5.3.2 5 to 20 MW
- 5.3.3 Above 20 MW
- 5.4 By Application
- 5.4.1 Oil and Gas
- 5.4.2 Chemical and Petrochemical
- 5.4.3 Power Generation
- 5.4.4 HVACR (Commercial Buildings)
- 5.4.5 Data Centers
- 5.4.6 Pulp and Paper
- 5.4.7 Food and Beverage
- 5.4.8 Others
- 5.5 By Geography
- 5.5.1 North America
- 5.5.1.1 United States
- 5.5.1.2 Canada
- 5.5.1.3 Mexico
- 5.5.2 Europe
- 5.5.2.1 Germany
- 5.5.2.2 United Kingdom
- 5.5.2.3 France
- 5.5.2.4 Italy
- 5.5.2.5 Spain
- 5.5.2.6 Russia
- 5.5.2.7 Rest of Europe
- 5.5.3 Asia Pacific
- 5.5.3.1 China
- 5.5.3.2 India
- 5.5.3.3 Japan
- 5.5.3.4 South Korea
- 5.5.3.5 ASEAN Countries
- 5.5.3.6 Rest of Asia Pacific
- 5.5.4 South America
- 5.5.4.1 Brazil
- 5.5.4.2 Argentina
- 5.5.4.3 Rest of South America
- 5.5.5 Middle East and Africa
- 5.5.5.1 Saudi Arabia
- 5.5.5.2 United Arab Emirates
- 5.5.5.3 Qatar
- 5.5.5.4 South Africa
- 5.5.5.5 Egypt
- 5.5.5.6 Rest of Middle East and Africa
- 5.5.1 North America
6 Competitive Landscape
- 6.1 Market Concentration
- 6.2 Strategic Moves (MandA, Partnerships, PPAs)
- 6.3 Market Share Analysis (Market Rank/Share for key companies)
- 6.4 Company Profiles (includes Global level Overview, Market level overview, Core Segments, Financials as available, Strategic Information, Products and Services, and Recent Developments)
- 6.4.1 SPX Technologies, Inc.
- 6.4.2 Baltimore Aircoil Company, Inc.
- 6.4.3 EVAPCO, Inc.
- 6.4.4 Johnson Controls International plc
- 6.4.5 Hamon and CIE (John Cockerill SA)
- 6.4.6 Brentwood Industries, Inc.
- 6.4.7 Babcock and Wilcox Enterprises, Inc.
- 6.4.8 ENEXIO Management GmbH
- 6.4.9 Thermax Ltd.
- 6.4.10 Artech Cooling Towers Pvt. Ltd.
- 6.4.11 Kelvion Holding GmbH
- 6.4.12 Paharpur Cooling Towers Ltd.
- 6.4.13 Liang Chi Industry Co., Ltd.
- 6.4.14 Star Cooling Towers Pvt. Ltd.
- 6.4.15 Delta Cooling Towers, Inc.
- 6.4.16 Reymsa Cooling Towers, Inc.
- 6.4.17 SPIG S.p.A (BandW)
- 6.4.18 Kimre, Inc.
- 6.4.19 Mesan Group
7 Market Opportunities & Future Outlook
- 7.1 White-space and Unmet-Need Assessment

