
PUBLISHER: Mordor Intelligence | PRODUCT CODE: 2034977

PUBLISHER: Mordor Intelligence | PRODUCT CODE: 2034977
Enterprise AI - Market Share Analysis, Industry Trends & Statistics, Growth Forecasts (2026 - 2031)
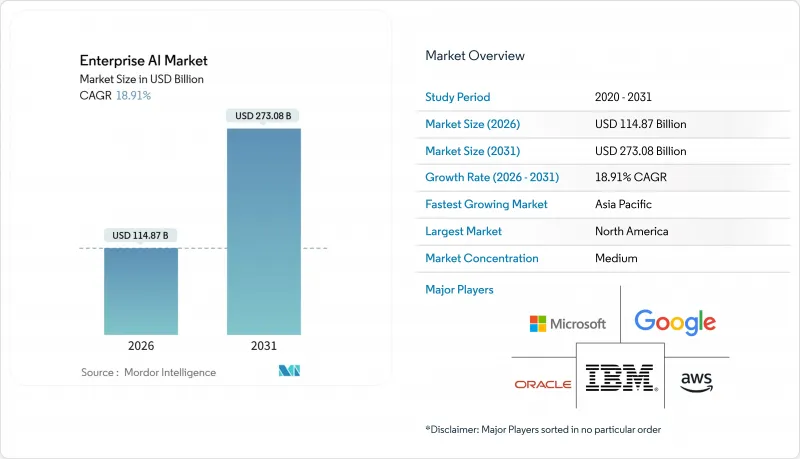
The Enterprise AI market size stood at USD 114.87 billion in 2026 and is projected to reach USD 273.08 billion by 2031, registering an 18.91% CAGR over 2026-2031.
Enterprises are moving past pilots into production deployments, encouraged by specialized computing hardware, cloud-native AI-as-a-Service platforms, and vertical foundation models that lower entry barriers for mid-market firms. Hardware accelerators are expanding faster than the overall Enterprise AI market as organizations provision GPU and TPU clusters to serve large language models at scale. Small and medium enterprises are adopting foundation models via low-code platforms, while demand for AI-driven automation in customer service, software development, and supply chain optimization is accelerating. Compliance-ready vendors are gaining an advantage in the European Union following the provisional application of the AI Act.
Global Enterprise AI Market Trends and Insights
Surging Demand for Automation and AI-Based Solutions
Enterprises are redeploying labor from repetitive tasks toward strategic workstreams by embedding conversational AI in customer support and code-generation models in software engineering. IBM disclosed that its Watson platform processed more than 1 billion enterprise customer interactions in 2024, a 40% increase from 2023. Labor savings strengthen the business case for GPUs and inference clusters that underpin large language models. Unlike prior rule-based automation waves, foundation models handle unstructured email, audio, and contract text, enabling new workflows such as contract review and clinical documentation. As accuracy improves, leadership teams are authorizing AI to execute decisions rather than simply recommend actions. The focus has shifted from cost reduction to revenue enablement, positioning automation as a board-level growth lever.
Need to Analyze Exponentially Growing Enterprise Data Sets
Global data creation is tracking toward 175 zettabytes in 2025, compelling enterprises to adopt AI systems that classify, extract, and act on petabyte-scale repositories. Retailers rely on real-time demand sensing across thousands of SKUs, while manufacturers detect anomalies from millions of IoT sensor signals. Salesforce reported that its Einstein platform analyzed more than 1 trillion customer data points per week in fiscal 2024, powering predictive lead scoring and churn alerts. Classic business intelligence tools cannot parse such high-dimensional inputs, so machine learning models that scale horizontally are now mission-critical. Organizations that monetize data through predictive insights are better positioned to create new revenue streams and streamline working capital.
Cultural and Skills Gap Slowing Enterprise Adoption
Demand for data scientists, MLOps engineers, and AI ethicists continues to exceed supply, inflating salaries and prolonging hiring cycles. Deloitte's 2024 survey of 2,800 executives revealed that 68% cited talent shortages as the primary barrier to scaling AI. Beyond headcount, cultural resistance persists, as employees remain skeptical of algorithmic recommendations that alter daily workflows. Only one-third of workers reported receiving adequate AI upskilling, highlighting misalignment between executive ambition and workforce readiness. Without comprehensive change-management programs, enterprises risk underutilizing expensive AI infrastructure. Skills scarcity also drives services spending, as firms rely on system integrators to fill capability gaps.
Other drivers and restraints analyzed in the detailed report include:
- Rise of Cloud-Based AI-as-a-Service Platforms
- Advances in Specialized Computing Hardware (GPU, TPU, NPU)
- Data-Sovereignty and Privacy-Regulation Hurdles
For complete list of drivers and restraints, kindly check the Table Of Contents.
Segment Analysis
Software and platforms accounted for 65.89% of revenue in 2025, as enterprises favored integrated toolchains that abstract away infrastructure complexity. The Enterprise AI market size for software reached USD 75.6 billion in 2025, underpinned by offerings such as Microsoft Azure AI Studio and Google Vertex AI. Hardware accelerators are forecast to post a 19.39% CAGR through 2031, the fastest among components, reflecting the compute intensity of large-scale inference workloads. Hardware's growth elevates the Enterprise AI market by expanding total addressable compute capacity and lowering latency thresholds for real-time applications.
Capital intensity is illustrated by NVIDIA, whose fiscal 2024 data center revenue rose 217% to USD 47.5 billion, driven by H100 and Blackwell pre-orders. Cloud providers are locking in multi-year supply commitments to guarantee GPU availability, while enterprises in regulated industries are procuring on-premises clusters to retain data control. Services revenue follows infrastructure complexity, as system integrators manage data engineering, model deployment, and continuous monitoring. The interplay between platforms, hardware, and services underscores a virtuous cycle, better silicon enables richer platforms, which in turn generate services demand.
Large enterprises held 71.43% of 2025 revenue thanks to in-house data science talent and the ability to amortize AI investments across global operations. However, SMEs are projected to outpace the broader Enterprise AI market with a 19.34% CAGR through 2031. Pre-trained foundation models embedded in SaaS applications eliminate the need for bespoke model development, enabling mid-market firms to match enterprise-grade capabilities. Salesforce Einstein and UiPath Automation Cloud illustrate how vendors package AI into low-code interfaces accessible to non-technical teams.
The democratization trend narrows the technology gap between global conglomerates and regional challengers. SMEs leverage pay-as-you-go inference endpoints to avoid upfront capex, while marketplace-based fine-tuning services allow domain-specific customization. Large enterprises still dominate custom model development for proprietary use cases such as algorithmic trading, but growth differentials suggest that AI maturity will converge across organization sizes by the decade's end.
The Enterprise AI Market Report is Segmented by Component (Software/Platform, Services, and Hardware Accelerators), Organization Size (Large Enterprise, and Small and Medium Enterprises), Functional Area (Customer-Facing, and More), Technology (Computer Vision, and More), End-User Industry (Manufacturing, and More), Deployment Model (On-Premise, and More), and Geography. The Market Forecasts are Provided in Terms of Value (USD).
Geography Analysis
North America accounted for 42.49% of Enterprise AI market revenue in 2025, as hyperscaler data centers, venture funding, and university research concentrated innovation in the United States and Canada. National AI research institutes feed a robust talent pipeline, while a permissive regulatory environment accelerates time-to-production. Canada's Vector Institute continues to commercialize academic breakthroughs, and Mexico is emerging as a nearshore location for AI-enabled business-process outsourcing. GPU supply constraints and salary inflation are current headwinds.
Asia-Pacific is projected to deliver the fastest CAGR of 19.92% through 2031, driven by government-backed sovereign AI programs and localized foundation models in China, India, Japan, and South Korea. China's USD 50 billion national AI plan finances domestic chip fabrication and model development, reducing reliance on foreign suppliers. India's IndiaAI mission allocates USD 1.2 billion to build indigenous infrastructure and train 500,000 professionals by 2027. Japan subsidizes AI in manufacturing and healthcare, while South Korea pursues leadership in AI semiconductors. Australia exploits AI in mining and financial services, leveraging advanced digital infrastructure.
Europe follows a measured trajectory, balancing innovation with strict governance under the AI Act. Germany, France, and the United Kingdom invest in public-private research hubs such as Fraunhofer Institutes and Station F, respectively. The Middle East and Africa are at an earlier stage of adoption but show momentum in smart city and energy optimization projects spearheaded by the United Arab Emirates and Saudi Arabia. South America, led by Brazil and Argentina, applies AI to precision agriculture and fintech. Infrastructure gaps and skills shortages temper growth in emerging regions, yet targeted investments and localization partnerships create openings for specialized vendors.
- Microsoft Corporation
- IBM Corporation
- Amazon Web Services Inc.
- Google LLC
- Oracle Corporation
- Hewlett Packard Enterprise Company
- NVIDIA Corporation
- SAP SE
- Intel Corporation
- Wipro Limited
- NEC Corporation
- Accenture plc
- ServiceNow Inc.
- DataRobot Inc.
- UiPath Inc.
- C3.ai Inc.
- Palantir Technologies
- H2O.ai Inc.
- Snowflake Inc.
- Databricks Inc.
Additional Benefits:
- The market estimate (ME) sheet in Excel format
- 3 months of analyst support
TABLE OF CONTENTS
1 NTRODUCTION
- 1.1 Study Assumptions and Market Definition
- 1.2 Scope of the Study
2 RESEARCH METHODOLOGY
3 EXECUTIVE SUMMARY
4 MARKET LANDSCAPE
- 4.1 Market Overview
- 4.2 Market Drivers
- 4.2.1 Surging Demand for Automation and AI-Based Solutions
- 4.2.2 Need to Analyse Exponentially Growing Enterprise Data Sets
- 4.2.3 Rise of Cloud-Based AI-as-a-Service Platforms
- 4.2.4 Advances in Specialised Computing Hardware (GPU, TPU, NPU)
- 4.2.5 Industry-Specific Foundation Models Democratising AI for SMEs
- 4.2.6 Net-Zero Pledges Driving AI-Enabled Carbon-Optimisation Tools
- 4.3 Market Restraints
- 4.3.1 Cultural and Skills Gap Slowing Enterprise Adoption
- 4.3.2 Data-Sovereignty and Privacy-Regulation Hurdles
- 4.3.3 High Implementation and Infrastructure Costs
- 4.3.4 Complexity in Integrating AI with Legacy Systems
- 4.4 Industry Value Chain Analysis
- 4.5 Regulatory Landscape
- 4.6 Technological Outlook
- 4.7 Porter's Five Forces Analysis
- 4.7.1 Bargaining Power of Buyers
- 4.7.2 Bargaining Power of Suppliers
- 4.7.3 Threat of New Entrants
- 4.7.4 Threat of Substitutes
- 4.7.5 Competitive Rivalry
- 4.8 Impact of Macroeconomic Factors on the Market
5 MARKET SIZE AND GROWTH FORECASTS (VALUE)
- 5.1 By Component
- 5.1.1 Software / Platform
- 5.1.2 Services
- 5.1.3 Hardware Accelerators
- 5.2 By Organization Size
- 5.2.1 Large Enterprise
- 5.2.2 Small and Medium Enterprises
- 5.3 By Functional Area
- 5.3.1 Customer-Facing
- 5.3.2 Operations and Supply-Chain
- 5.3.3 Finance and Risk
- 5.3.4 HR and Talent
- 5.4 By Technology
- 5.4.1 Machine Learning / Foundation Models
- 5.4.2 Natural-Language Processing
- 5.4.3 Computer Vision
- 5.4.4 Decision Intelligence / Optimisation
- 5.5 By End-User Industry
- 5.5.1 Banking, financial services and insurance (BFSI)
- 5.5.2 Manufacturing
- 5.5.3 Automotive and Mobility
- 5.5.4 IT and Telecom
- 5.5.5 Media and Advertising
- 5.5.6 Healthcare and Life-Sciences
- 5.5.7 Retail and e-Commerce
- 5.5.8 Energy and Utilities
- 5.5.9 Other End-User Industries
- 5.6 By Deployment Model
- 5.6.1 On-Premise
- 5.6.2 Cloud
- 5.6.3 Hybrid / Edge
- 5.7 By Geography
- 5.7.1 North America
- 5.7.1.1 United States
- 5.7.1.2 Canada
- 5.7.1.3 Mexico
- 5.7.2 Europe
- 5.7.2.1 Germany
- 5.7.2.2 United Kingdom
- 5.7.2.3 France
- 5.7.2.4 Russia
- 5.7.2.5 Rest of Europe
- 5.7.3 Asia-Pacific
- 5.7.3.1 China
- 5.7.3.2 Japan
- 5.7.3.3 India
- 5.7.3.4 South Korea
- 5.7.3.5 Australia
- 5.7.3.6 Rest of Asia-Pacific
- 5.7.4 Middle East and Africa
- 5.7.4.1 Middle East
- 5.7.4.1.1 Saudi Arabia
- 5.7.4.1.2 United Arab Emirates
- 5.7.4.1.3 Rest of Middle East
- 5.7.4.2 Africa
- 5.7.4.2.1 South Africa
- 5.7.4.2.2 Egypt
- 5.7.4.2.3 Rest of Africa
- 5.7.4.1 Middle East
- 5.7.5 South America
- 5.7.5.1 Brazil
- 5.7.5.2 Argentina
- 5.7.5.3 Rest of South America
- 5.7.1 North America
6 COMPETITIVE LANDSCAPE
- 6.1 Market Concentration
- 6.2 Strategic Developments
- 6.3 Vendor Positioning Analysis
- 6.4 Company Profiles (includes Global-Level Overview, Market-Level Presence, Core Segments, Financials, Strategic Information, Market Rank/Share, Products and Services, Recent Developments)
- 6.4.1 Microsoft Corporation
- 6.4.2 IBM Corporation
- 6.4.3 Amazon Web Services Inc.
- 6.4.4 Google LLC
- 6.4.5 Oracle Corporation
- 6.4.6 Hewlett Packard Enterprise Company
- 6.4.7 NVIDIA Corporation
- 6.4.8 SAP SE
- 6.4.9 Intel Corporation
- 6.4.10 Wipro Limited
- 6.4.11 NEC Corporation
- 6.4.12 Accenture plc
- 6.4.13 ServiceNow Inc.
- 6.4.14 DataRobot Inc.
- 6.4.15 UiPath Inc.
- 6.4.16 C3.ai Inc.
- 6.4.17 Palantir Technologies
- 6.4.18 H2O.ai Inc.
- 6.4.19 Snowflake Inc.
- 6.4.20 Databricks Inc.
7 MARKET OPPORTUNITIES AND FUTURE OUTLOOK
- 7.1 White-Space and Unmet-Need Assessment

