
PUBLISHER: Mordor Intelligence | PRODUCT CODE: 2034980

PUBLISHER: Mordor Intelligence | PRODUCT CODE: 2034980
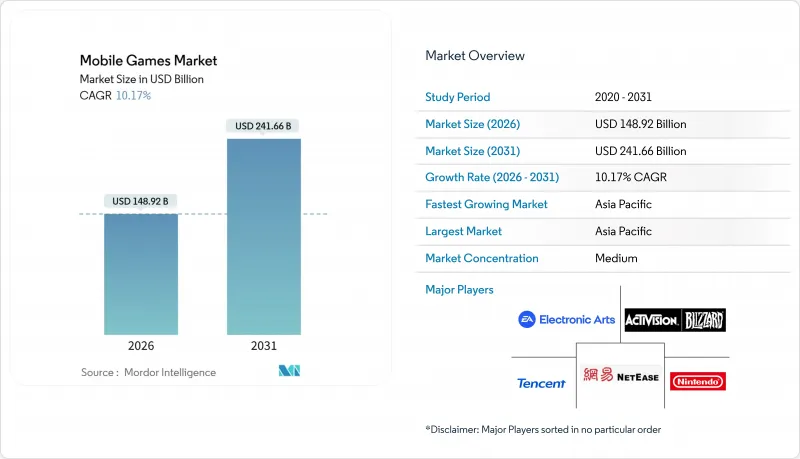
Mobile Games - Market Share Analysis, Industry Trends & Statistics, Growth Forecasts (2026 - 2031)
The mobile games market size stood at USD 148.92 billion in 2026 and is projected to reach USD 241.66 billion by 2031, recording a 10.17% CAGR.
Expanding 5G coverage is lowering latency below 20 milliseconds, which is unlocking real-time multiplayer play and converting casual smartphone owners into committed gamers. Telco-bundled cloud libraries are widening paid access in emerging economies, while generative artificial intelligence is compressing live-ops production cycles and lifting 30-day retention rates above historical norms. Subscription passes and hybrid monetization are diluting single-purchase dependency, and foldable handsets are redefining premium on-the-go experiences. Competitive intensity remains high as mid-tier studios use AI automation to match update cadences previously reserved for the largest publishers.
Global Mobile Games Market Trends and Insights
5G Roll-Outs Lowering Latency
Standalone 5G cores separate control and user planes, driving sub-20 millisecond ping that rivals wired consoles. In 2025, global 5G subscriptions passed 1.9 billion, and operators in South Korea and China began selling gaming-grade network slices to premium subscribers. Smartphone chipsets such as Snapdragon Elite Gaming exploit this bandwidth, ensuring stable 120 frame-per-second play. As a result, esports-ready titles that once required a PC now launch simultaneously on mobile, broadening the mobile games market to competitive segments. Publishers consequently unlock sponsorship and event revenues that were formerly confined to console ecosystems.
Telco-Led Cloud Gaming Bundles Stimulating ARPDAU
Operators including Reliance Jio and Vodafone add curated game libraries to data plans, pushing cloud libraries to more than 50 million monthly active users in India alone. These bundles remove multi-gigabyte downloads, sidestep app-store commissions, and raise average revenue per daily active user by 22%. Ericsson ConsumerLab showed that 40% of cloud gamers in Southeast Asia rely solely on operator portals. For publishers, the model extends the mobile games market into price-sensitive audiences, while telcos monetize fixed assets more efficiently. As the approach spreads across Middle East and Africa, incremental ARPDAU uplift is expected to compound revenue growth.
Country-Level Loot-Box Regulations Dampening IAP
Belgium and the Netherlands classify loot boxes as gambling, prompting publishers to strip random-reward mechanics or exit those storefronts. The United Kingdom and Australia are drafting similar controls that could widen compliance costs. Electronic Arts removed paid packs from its flagship sports titles in the affected markets, losing 12% ARPU in the first year. The clampdown accelerates shifts toward battle passes and cosmetic microtransactions, yet near-term friction trims the mobile games market growth by 1.4 percentage points within the forecast window.
Other drivers and restraints analyzed in the detailed report include:
- AI-Generated Live-Ops Content Boosting Retention
- Contextual-First Advertising Revenues Post-IDFA
- Rising User Acquisition CPI on iOS
For complete list of drivers and restraints, kindly check the Table Of Contents.
Segment Analysis
In 2025, in-app purchases generated 55.13% of mobile games market revenue, but subscriptions and season passes are pacing for the highest 18.42% CAGR through 2031. The pivot responds to player fatigue with unpredictable spending and to growing scrutiny over random rewards. Publishers such as Epic Games now bundle cosmetics, in-game currency, and premium events into monthly passes that secure recurring cash flow. Hybrid models that layer optional purchases over a base subscription uplift lifetime value by roughly 40%, creating a powerful lever for revenue diversification within the mobile games market.
The strategic impact extends beyond direct earnings. Predictable subscription income enables steadier content investment and cushions against advertising cyclicality. As regulators tighten loot-box rules, transparent fee structures lower legal exposure. With Gen Z players favoring fixed costs, the momentum behind subscription schemes is likely to accelerate, embedding the model as a core pillar of the mobile games industry by the decade's close.
Android accounted for 71.32% of 2025 spend, reflecting its ubiquity in high-volume emerging regions. Yet a fast-rising platform class (cloud streaming and progressive web apps) holds less than 2% today and is forecast for a 40.21% CAGR to 2031. Telcos that bundle low-latency libraries into premium data plans are bypassing gatekeeper stores and 30% commissions, a dynamic that reshapes distribution economics and enlarges the mobile games market in previously under-monetized territories.
Microsoft, Nvidia, and Alphabet report that mobile devices now drive more than one-third of total cloud-gaming hours, evidence that the market is ready for download-free access. As mature networks reduce buffering, graphically intensive console titles become playable on handsets, drawing new demographics into premium content. The shift also mitigates storage constraints and long install times that have historically suppressed user conversion.
The Mobile Games Market Report is Segmented by Monetization Type (In-App Purchases, Subscriptions, and More), Platform (Android, IOS, and Cloud Streaming), Device Type (Smartphones, Foldables, and Tablets), Game Genre (Casual, Action, Strategy, and More), Player Demographic (Gen Z, Millennials, and More), and Geography (North America, South America, Europe, and More). The Market Forecasts are Provided in Terms of Value (USD).
Geography Analysis
Asia Pacific produced 49.23% of global revenue in 2025, anchored by China's resumed game license approvals and India's explosive smartphone adoption. Chinese regulators cleared more than 1,000 domestic mobile titles in 2024, unlocking pent-up launch pipelines. Meanwhile, India surpassed 450 million gamers, driven by sub-USD 100 handsets and unlimited data bundles at USD 3 per month. Mature spenders in Japan and South Korea lift per-user averages above USD 80, balancing lower-priced mass markets across Southeast Asia.
North America and Europe combined for roughly a 35% share, with the United States remaining the largest single-country contributor. However, divergent European loot-box rules raise compliance burdens, prompting publishers to regionalize monetization mechanics and content. Cloud gaming adoption is high, reflecting households with multiple devices that value seamless migration between console and mobile.
Africa, the fastest-growing region with a 12.51% CAGR, benefits from mobile-money ecosystems that process more than USD 700 billion annually. Carrier billing allows prepaid users to spend within games without bank accounts, broadening the mobile games market beyond traditional financial rails. Middle Eastern youth demographics and sovereign digital-economy investments further amplify regional growth potential, while South America offers resilience through low-cost entertainment demand despite currency volatility.
- Tencent Holdings Ltd.
- NetEase Inc.
- Activision Blizzard Inc.
- Electronic Arts Inc.
- Playrix Holding Ltd.
- Lilith Games
- Sea Ltd. (Garena)
- Zynga Inc. (Take-Two)
- Krafton Inc.
- Supercell Oy
- GungHo Online Entertainment Inc.
- miHoYo Co., Ltd.
- Rovio Entertainment Group
- King Digital Entertainment PLC
- Kabam Games Inc.
- Scopely Inc.
- Glu Mobile LLC
- Playrix Holding Ltd.
- NCSoft Corporation
- DeNA Co., Ltd.
Additional Benefits:
- The market estimate (ME) sheet in Excel format
- 3 months of analyst support
TABLE OF CONTENTS
1 INTRODUCTION
- 1.1 Study Assumptions and Market Definition
- 1.2 Scope of the Study
2 RESEARCH METHODOLOGY
3 EXECUTIVE SUMMARY
4 MARKET LANDSCAPE
- 4.1 Market Overview
- 4.2 Market Drivers
- 4.2.1 5G Roll-outs Lowering Latency
- 4.2.2 Contextual-First Advertising Revenues Post-IDFA
- 4.2.3 Telco-Led Cloud Gaming Bundles Stimulating ARPDAU
- 4.2.4 Gen-Z Preference for Hyper-Casual Gameplay
- 4.2.5 AI-Generated Live-Ops Content Boosting Retention
- 4.2.6 Cross-Platform Progression Increasing LTV
- 4.3 Market Restraints
- 4.3.1 Country-Level Loot-Box Regulations Dampening IAP
- 4.3.2 Rising User Acquisition CPI on iOS
- 4.3.3 App-Store Tax Policy Uncertainty
- 4.3.4 High 5G Device Battery Drain Limiting Session Length
- 4.4 Industry Value Chain Analysis
- 4.5 Regulatory Landscape
- 4.6 Technological Outlook
- 4.7 Porter's Five Forces Analysis
- 4.7.1 Bargaining Power of Suppliers
- 4.7.2 Bargaining Power of Buyers
- 4.7.3 Threat of New Entrants
- 4.7.4 Threat of Substitutes
- 4.7.5 Intensity of Competitive Rivalry
- 4.8 Impact of Macroeconomic Factors on the Market
5 MARKET SIZE AND GROWTH FORECASTS (VALUE)
- 5.1 By Monetization Type
- 5.1.1 In-App Purchases
- 5.1.2 Subscription and Season Passes
- 5.1.3 Advertising (Rewarded Video, Interstitial, Native)
- 5.1.4 Premium Paid Downloads
- 5.2 By Platform
- 5.2.1 Android
- 5.2.2 iOS
- 5.2.3 Third-Party Android Stores
- 5.2.4 Cloud Streaming / Progressive Web App
- 5.3 By Device Type
- 5.3.1 Smartphones
- 5.3.2 Foldable Smartphones
- 5.3.3 Tablets
- 5.4 By Game Genre
- 5.4.1 Casual and Hyper-Casual
- 5.4.2 Action / Adventure
- 5.4.3 Strategy and MOBA
- 5.4.4 Role-Playing (RPG)
- 5.4.5 Sports and Racing
- 5.4.6 Casino and Card
- 5.4.7 Puzzle
- 5.4.8 Simulation
- 5.5 By Player Demographic
- 5.5.1 Gen Z (Below 25 Years)
- 5.5.2 Millennials (25-40 Years)
- 5.5.3 Gen X and Above (Over 40 Years)
- 5.6 By Geography
- 5.6.1 North America
- 5.6.1.1 United States
- 5.6.1.2 Canada
- 5.6.1.3 Mexico
- 5.6.2 South America
- 5.6.2.1 Brazil
- 5.6.2.2 Argentina
- 5.6.2.3 Rest of South America
- 5.6.3 Europe
- 5.6.3.1 Germany
- 5.6.3.2 United Kingdom
- 5.6.3.3 France
- 5.6.3.4 Italy
- 5.6.3.5 Spain
- 5.6.3.6 Russia
- 5.6.3.7 Rest of Europe
- 5.6.4 Asia Pacific
- 5.6.4.1 China
- 5.6.4.2 Japan
- 5.6.4.3 South Korea
- 5.6.4.4 India
- 5.6.4.5 Australia
- 5.6.4.6 New Zealand
- 5.6.4.7 Rest of Asia Pacific
- 5.6.5 Middle East
- 5.6.5.1 United Arab Emirates
- 5.6.5.2 Saudi Arabia
- 5.6.5.3 Turkey
- 5.6.5.4 Rest of Middle East
- 5.6.6 Africa
- 5.6.6.1 South Africa
- 5.6.6.2 Nigeria
- 5.6.6.3 Kenya
- 5.6.6.4 Rest of Africa
- 5.6.1 North America
6 COMPETITIVE LANDSCAPE
- 6.1 Market Concentration
- 6.2 Strategic Developments
- 6.3 Market Share Analysis
- 6.4 Company Profiles (includes Global Level Overview, Market Level Overview, Core Segments, Financials as Available, Strategic Information, Market Rank/Share for Key Companies, Products and Services, and Recent Developments)
- 6.4.1 Tencent Holdings Ltd.
- 6.4.2 NetEase Inc.
- 6.4.3 Activision Blizzard Inc.
- 6.4.4 Electronic Arts Inc.
- 6.4.5 Playrix Holding Ltd.
- 6.4.6 Lilith Games
- 6.4.7 Sea Ltd. (Garena)
- 6.4.8 Zynga Inc. (Take-Two)
- 6.4.9 Krafton Inc.
- 6.4.10 Supercell Oy
- 6.4.11 GungHo Online Entertainment Inc.
- 6.4.12 miHoYo Co., Ltd.
- 6.4.13 Rovio Entertainment Group
- 6.4.14 King Digital Entertainment PLC
- 6.4.15 Kabam Games Inc.
- 6.4.16 Scopely Inc.
- 6.4.17 Glu Mobile LLC
- 6.4.18 Playrix Holding Ltd.
- 6.4.19 NCSoft Corporation
- 6.4.20 DeNA Co., Ltd.
7 MARKET OPPORTUNITIES AND FUTURE OUTLOOK
- 7.1 White-Space and Unmet-Need Assessment

