
PUBLISHER: Mordor Intelligence | PRODUCT CODE: 2035072

PUBLISHER: Mordor Intelligence | PRODUCT CODE: 2035072
Energy Storage - Market Share Analysis, Industry Trends & Statistics, Growth Forecasts (2026 - 2031)
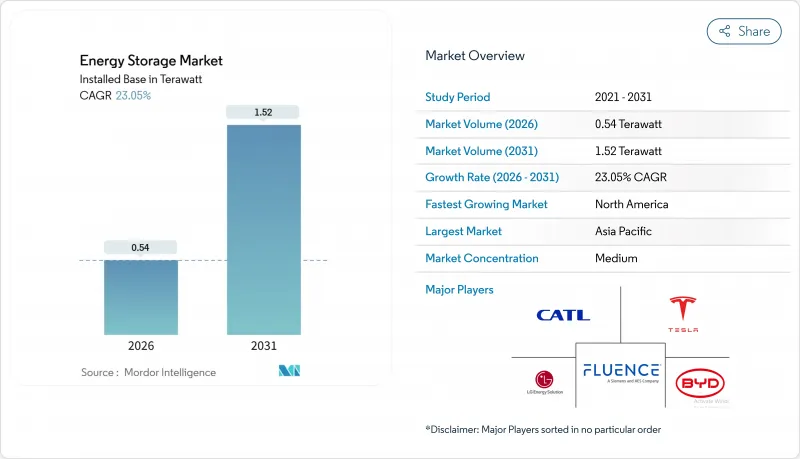
The Energy Storage Market size in terms of installed base is expected to grow from 0.54 Terawatt in 2026 to 1.52 Terawatt by 2031, at a CAGR of 23.05% during the forecast period (2026-2031).
Cost breakthroughs in lithium-iron-phosphate batteries, long-duration storage mandates in China, and the U.S. Inflation Reduction Act's standalone storage investment tax credit are driving a structural pivot from backup-only use toward multi-hour arbitrage and ancillary-service revenue stacking. Utilities are substituting natural-gas peakers with six-hour systems, data-center operators are pairing flywheels with batteries to secure sub-second power quality, and EV-charging corridor developers are embedding storage to avoid costly grid-upgrades. Competitive dynamics favor vertically integrated Chinese cell makers that can undercut Western rivals by 15% on turnkey prices, although North American demand growth is the fastest globally as state-level mandates layer on top of federal incentives.
Global Energy Storage Market Trends and Insights
Rapid LFP Battery Cost Declines Driving above 6-Hour BESS Adoption
Stationary-grade lithium-iron-phosphate cell prices slid to USD 70 per kWh in late 2025, down from USD 115 a year earlier, enabling six-hour and eight-hour installations to beat natural-gas peakers wherever peak-to-off-peak spreads exceed USD 40 per MWh. CATL's commercial launch of sodium-ion cells in 2025 added extra price pressure by offering utilities a lower-cost option for cold-weather regions. California utilities awarded 3.2 GW of six-hour contracts during 2025 to replace retiring gas turbines under Senate Bill 100 targets. Texas ERCOT saw 2.1 GW of merchant storage reach COD in 2025, aimed at exploiting summer price spikes that crest above USD 200 per MWh. Compliance costs tied to IEC 62619 safety certification add USD 5-8 per kWh, yet margins remain robust because the revenue window has widened from four to six hours.
Grid-Scale Incentive Schemes (IRA, EU RED III, China Long-Duration Mandate)
The U.S. Inflation Reduction Act's 30% standalone storage ITC, in force through 2032, unlocked USD 12 billion of utility-scale financing in 2025, led by projects in Texas, Arizona, and Nevada. Europe's RED III directive, transposed into national law by mid-2025, obliges member states to secure grid-flexibility assets to reach a 42.5% renewables share by 2030; Germany alone earmarked EUR 500 million (USD 545 million) for a 10 GW build-out. China mandated 180 GW of long-duration storage by 2027 and had 73.76 GW online at end-2024, leaving a 106 GW gap that is propelling compressed-air, pumped-hydro, and hydrogen projects.
Scarcity of Suitable Reservoir Sites Limiting New Pumped Hydro
Europe and Japan face topographical and environmental hurdles that curtail new pumped-hydro projects, holding additions to just 1.2 GW across the EU between 2020 and 2025, while batteries added 28 GW. Natura 2000 habitat protections, seismic risk zoning, and decade-long permitting cycles are steering investors toward compressed-air and hydrogen alternatives. In the U.S., the Federal Energy Regulatory Commission received only 12 license applications during 2024-2025 versus 40 twelve years earlier. Australia's Snowy 2.0 overrun of AUD 2 billion (USD 1.3 billion) in 2025 underscored tunneling risks.
Other drivers and restraints analyzed in the detailed report include:
- Mandatory GCC Renewable-Integration Targets Boosting Thermal & CAES
- Data-Center Power-Quality Demands Spurring Flywheel & BESS
- Vanadium/Zinc Electrolyte Supply Volatility Hindering Flow-Battery Scale-Up
For complete list of drivers and restraints, kindly check the Table Of Contents.
Segment Analysis
Batteries accounted for 53.84% of the 2025 energy storage market size, anchored by LFP and growing sodium-ion volumes, while hydrogen storage is forecast to expand at a 38.50% CAGR through 2031 as utilities seek 100-hour seasonal balancing resources. Pumped hydro, thermal molten-salt tanks, compressed-air, liquid-air, flywheel, and gravity systems collectively held a 46.16% share, positioning electrochemical providers to dominate short-cycle revenues even as multi-day technologies close the cost gap.
Solid-state lithium remains confined to pilot lines, lead-acid is losing share in telecom and residential backup, and flow batteries languish below 3% market penetration because of electrolyte volatility. Mitsubishi Power's Utah hydrogen cavern and Highview Power's cryogenic plant showcase commercial viability, but capital intensity above USD 400 per kWh limits mainstream uptake. Nonetheless, cumulative cost curves are converging as scale-up proceeds, suggesting long-duration challengers will secure greater energy storage market share beyond 2031.
The Energy Storage Market Report is Segmented by Technology (Batteries, Pumped-Storage Hydroelectricity, Thermal Energy Storage, Compressed Air Energy Storage, Liquid Air/Cryogenic Storage, Flywheel Energy Storage, and More), Connectivity (On-Grid and Off-Grid), Application (Grid-Scale Utility, Residential Behind-The-Meter, and More), and Geography (North America, Europe, Asia-Pacific, South America, and Middle East and Africa).
Geography Analysis
Asia-Pacific possessed 45.11% of global capacity in 2025 owing to China's 73.76 GW installed base, yet growth is moderating as policy emphasis migrates from pure capacity to utilization efficiency. India's 4.2 GW of 2025 additions stemmed from tenders that bundled eight GW of solar with two GW of four-hour storage, while Japan and South Korea focused on frequency-regulation niches within land-constrained markets.
North America is the velocity leader, forecast to advance at a 33.47% CAGR through 2031 as the Inflation Reduction Act and state mandates converge. The United States added 9.4 GW in 2025, with Texas and California accounting for nearly 75% of that total, and Canada's Alberta and Ontario provinces following suit. Mexico's 1.2 GW solar-plus-storage tender remains in regulatory review, signaling latent upside once policy clarity improves.
Europe installed 5.1 GW in 2025, spurred by Germany's EUR 500 million federal grant program and the UK capacity market's 15-year contracts. Spain and France integrated storage into renewable auctions, and Nordic countries embedded BESS in expanding data-center clusters to monetize frequency-containment services. The Middle East and Africa contributed 1.6 GW, with the UAE and Saudi Arabia leading deployments that favor thermal and compressed-air chemistries suited for desert climates. South America's 1.3 GW, mostly in Brazil and Chile, shows that auction frameworks contingent on firm capacity are becoming the region's primary accelerator.
- Contemporary Amperex Technology Co. Ltd. (CATL)
- LG Energy Solution Ltd.
- Tesla Inc.
- BYD Co. Ltd.
- Fluence Energy Inc.
- Wartsila Energy
- Siemens Gamesa Renewable Energy
- GS Yuasa Corporation
- NGK Insulators Ltd.
- Samsung SDI Co. Ltd.
- General Electric (Vernova)
- ABB Ltd.
- Hitachi Energy Ltd.
- Eaton Corporation
- Mitsubishi Power Americas |
- AES Corporation
- Voith Hydro GmbH
- ANDRITZ AG
- Hydrostor Inc.
- Highview Powe
- Amber Kinetics Inc
Additional Benefits:
- The market estimate (ME) sheet in Excel format
- 3 months of analyst support
TABLE OF CONTENTS
1 Introduction
- 1.1 Study Assumptions & Market Definition
- 1.2 Scope of the Report
2 Research Methodology
3 Executive Summary
4 Market Landscape
- 4.1 Market Overview
- 4.2 Market Drivers
- 4.2.1 Rapid LFP Battery Cost Declines Driving >6-Hour BESS Adoption (Asia-Pacific)
- 4.2.2 Grid-Scale Incentive Schemes (IRA-US, EU RED III, China Long-Duration Mandate)
- 4.2.3 Mandatory GCC Renewable-Integration Targets Boosting Thermal & CAES
- 4.2.4 Data-Center Power-Quality Demands Spurring Flywheel & BESS (NA, Nordics)
- 4.2.5 EV-Charging Corridor Build-outs Requiring Stationary Storage
- 4.2.6 Corporate PPA Surge Triggering Behind-the-Meter Storage (EU, AUS)
- 4.3 Market Restraints
- 4.3.1 Scarcity of Suitable Reservoir Sites Limiting New Pumped Hydro (EU, JP)
- 4.3.2 Vanadium/Zinc Electrolyte Supply Volatility Hindering Flow-Battery Scale-up
- 4.3.3 Stringent Fire Codes (NFPA 855, IEC 62933) Raising Urban BESS CAPEX
- 4.3.4 Revenue-Stacking Uncertainty in Emerging Markets
- 4.4 Supply-Chain Analysis
- 4.5 Government Policies & Regulations
- 4.6 Technological Outlook
- 4.7 Energy Storage Price Trends & Forecast
- 4.8 Installed Capacity & Deployment Analysis
- 4.9 Porter's Five Forces
- 4.9.1 Bargaining Power of Suppliers
- 4.9.2 Bargaining Power of Buyers
- 4.9.3 Threat of New Entrants
- 4.9.4 Threat of Substitutes
- 4.9.5 Intensity of Competitive Rivalry
5 Market Size & Growth Forecasts
- 5.1 By Technology
- 5.1.1 Batteries (Lithium-ion, Solid-State Li, Sodium-ion, Lead-acid, Sodium-Sulfur, and Flow Batteries (Vanadium, Zinc-Bromine))
- 5.1.2 Pumped-Storage Hydroelectricity
- 5.1.3 Thermal Energy Storage (Sensible Heat (Molten Salt, Water), Latent Heat (Phase-Change Materials), Thermochemical)
- 5.1.4 Compressed Air Energy Storage
- 5.1.5 Liquid Air/Cryogenic Storage
- 5.1.6 Flywheel Energy Storage
- 5.1.7 Gravity-Based Storage
- 5.1.8 Hydrogen-Based Storage (Power-to-H2-to-Power)
- 5.1.9 Other Emerging Technologies (Iron-Air, Zinc-Air)
- 5.2 By Connectivity
- 5.2.1 On-Grid
- 5.2.2 Off-Grid
- 5.3 By Application
- 5.3.1 Grid-Scale Utility (Front-of-Meter)
- 5.3.2 Residential Behind-the-Meter
- 5.3.3 Commercial and Industrial Behind-the-Meter
- 5.3.4 Data Centers and Critical Facilities
- 5.3.5 Remote and Off-Grid/Microgrids
- 5.3.6 Others (Transportation and Rail Electrification, EV-Charging Infrastructure, Transmission and Distribution Deferral)
- 5.4 By Geography
- 5.4.1 North America
- 5.4.1.1 United States
- 5.4.1.2 Canada
- 5.4.1.3 Mexico
- 5.4.2 Europe
- 5.4.2.1 United Kingdom
- 5.4.2.2 Germany
- 5.4.2.3 France
- 5.4.2.4 Spain
- 5.4.2.5 Nordic Countries
- 5.4.2.6 Russia
- 5.4.2.7 Rest of Europe
- 5.4.3 Asia-Pacific
- 5.4.3.1 China
- 5.4.3.2 India
- 5.4.3.3 Japan
- 5.4.3.4 South Korea
- 5.4.3.5 ASEAN Countries
- 5.4.3.6 Rest of Asia-Pacific
- 5.4.4 South America
- 5.4.4.1 Brazil
- 5.4.4.2 Argentina
- 5.4.4.3 Colombia
- 5.4.4.4 Rest of South America
- 5.4.5 Middle East and Africa
- 5.4.5.1 United Arab Emirates
- 5.4.5.2 Saudi Arabia
- 5.4.5.3 South Africa
- 5.4.5.4 Egypt
- 5.4.5.5 Rest of Middle East and Africa
- 5.4.1 North America
6 Competitive Landscape
- 6.1 Market Concentration
- 6.2 Strategic Moves (M&A, Partnerships, PPAs)
- 6.3 Market Share Analysis (Market Rank/Share for key companies)
- 6.4 Company Profiles (includes Global level Overview, Market level overview, Core Segments, Financials as available, Strategic Information, Products & Services, and Recent Developments)
- 6.4.1 Contemporary Amperex Technology Co. Ltd. (CATL)
- 6.4.2 LG Energy Solution Ltd.
- 6.4.3 Tesla Inc.
- 6.4.4 BYD Co. Ltd.
- 6.4.5 Fluence Energy Inc.
- 6.4.6 Wartsila Energy
- 6.4.7 Siemens Gamesa Renewable Energy
- 6.4.8 GS Yuasa Corporation
- 6.4.9 NGK Insulators Ltd.
- 6.4.10 Samsung SDI Co. Ltd.
- 6.4.11 General Electric (Vernova)
- 6.4.12 ABB Ltd.
- 6.4.13 Hitachi Energy Ltd.
- 6.4.14 Eaton Corporation
- 6.4.15 Mitsubishi Power Americas |
- 6.4.16 AES Corporation
- 6.4.17 Voith Hydro GmbH
- 6.4.18 ANDRITZ AG
- 6.4.19 Hydrostor Inc.
- 6.4.20 Highview Powe
- 6.4.21 Amber Kinetics Inc
7 Market Opportunities & Future Outlook
- 7.1 White-space & Unmet-Need Assessment

