
PUBLISHER: Mordor Intelligence | PRODUCT CODE: 2035165

PUBLISHER: Mordor Intelligence | PRODUCT CODE: 2035165
Sustainability - Market Share Analysis, Industry Trends & Statistics, Growth Forecasts (2026 - 2031)
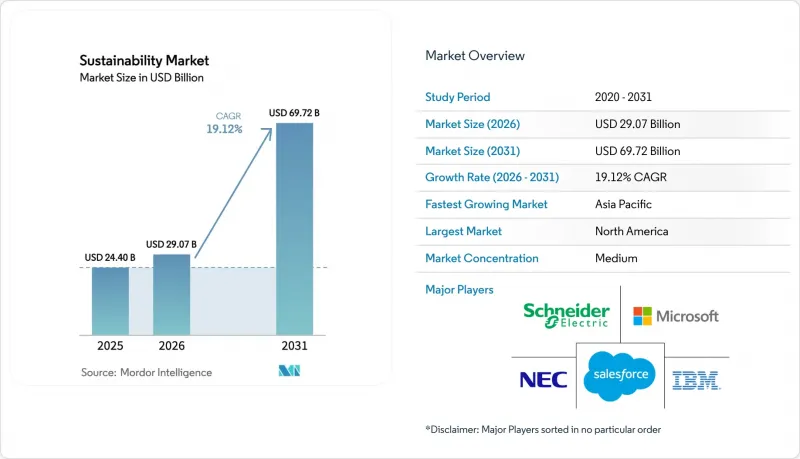
Sustainability market size in 2026 is estimated at USD 29.07 billion, growing from 2025 value of USD 24.40 billion with 2031 projections showing USD 69.72 billion, growing at 19.12% CAGR over 2026-2031.
Rising regulatory alignment, notably the European Union's Corporate Sustainability Reporting Directive and climate-disclosure rules in the United States, is converting environmental reporting from a discretionary activity into a compliance obligation. The resulting surge in demand for automated data-management platforms is reinforced by corporate net-zero targets, sustainability-linked financing, and real-time analytics that demonstrate clear cost-saving potential. Suppliers that integrate IoT sensors with artificial intelligence are capturing early advantage because enterprises now prioritize predictive insights over passive data collection. Meanwhile, a fragmented standards landscape and scarcity of specialist talent in emerging economies temper near-term uptake, especially among smaller businesses that struggle with implementation costs.
Global Sustainability Market Trends and Insights
Mandatory ESG-reporting Regulations Accelerating Solution Uptake
Extensive disclosure mandates now cover more than 50,000 European companies, and parallel rules require climate data from US federal contractors. Digital tagging obligations under the EU directive have created urgent demand for automated collection tools that ingest structured environmental data and feed assurance workflows. In North America, new state-level measures add jurisdiction-specific metrics, pushing multinational firms toward platforms that reconcile overlapping rulesets. Penalties for non-compliance often exceed platform licence fees, making procurement decisions relatively price-insensitive. Suppliers that embed XBRL tagging and pre-configured templates are seeing sales cycles shorten despite budget scrutiny.
Net-zero Commitments Driving Carbon Accounting Demand in North America
More than 1,500 corporations have public science-based targets, and investors now request granular Scope 3 emissions data. Financial institutions face additional scrutiny under the Partnership for Carbon Accounting Financials standard, which requires financed-emissions baselines across lending books. Complexity around category-based emission factors is propelling the adoption of AI engines that can sift supplier invoices and map them against thousands of activity codes. The trend is cascading down supply chains, forcing smaller vendors to upload verified emissions data or risk disqualification.
Fragmented Standards Causing Data-interoperability Issues
Global organizations often juggle GRI, SASB, and TCFD frameworks, each with discrete metrics, units, and cutoff dates. Legacy platforms rarely support harmonized application programming interfaces, forcing firms to run separate instances or rely on brittle spreadsheet bridges. Integration projects inflate the total cost of ownership and postpone the return on investment, especially when suppliers lack shared data taxonomies. Regional standard-setting bodies promise convergence, yet timelines for full alignment remain uncertain.
Other drivers and restraints analyzed in the detailed report include:
- Sustainability-linked Financing Pushing Adoption in APAC Manufacturing
- AI-led Resource-efficiency Gains in Heavy Industries
- Skilled-talent Shortage in Southeast-Asian SMEs
For complete list of drivers and restraints, kindly check the Table Of Contents.
Segment Analysis
Solutions generated 68.12% of sustainability market revenue in 2025, underpinned by sensor arrays, cloud platforms, and edge-processing gateways that anchor data acquisition. Services revenue is climbing faster at an 18.34% CAGR because organizations must tailor deployments to divergent regulatory, operational, and industry contexts. During 2026-2031, procurement teams increasingly bundle advisory engagements with platform licences to accelerate go-live schedules. Systems integrators design taxonomies that map facility-level emissions to jurisdiction-specific disclosures, ensuring downstream audit readiness. Analytics consultants interpret anomalies and translate them into investment-grade insights, moving client focus from pure compliance toward performance optimization. Large enterprises dominate spending, yet mid-market demand is rising as simplified SaaS offerings shrink upfront capital hurdles. Vendors that cultivate deep regulatory expertise and offer modular service catalogs are improving renewal rates and recurring revenue mix. As service margins eclipse hardware margins, several platform providers now emphasize managed-service contracts, locking in multi-year cash flows while strengthening customer intimacy. The pattern signals a maturing sustainability market where differentiation lies in post-deployment value delivery rather than basic data capture.
IoT underpins 40.21% of the sustainability market, supplying low-power devices that stream temperature, particulate, and greenhouse-gas data from factories, offices, and logistics fleets. Yet AI and analytics are projected to deliver a 20.08% CAGR to 2031, shifting boardroom conversations from data availability to actionable foresight. Edge-AI modules compress and preprocess sensor streams, easing bandwidth constraints and enabling sub-second anomaly detection inside industrial plants. Cloud hyperscalers add elasticity that supports seasonal scaling or acquisitions without on-premise hardware refreshes. Blockchain nodes certify provenance in supply chains, providing immutable ledgers that deter greenwashing claims. Digital twins simulate policy choices, such as adjusting HVAC setpoints against indoor-air-quality thresholds, allowing facilities managers to quantify trade-offs before implementation. Technology convergence prompts suite providers to embed AI libraries, data-lake connectors, and low-code orchestration tools inside single subscriptions. Start-ups focusing on sector-specific data models, cement kilns, cold-chain warehousing, or wastewater treatment, win contracts from operators that prefer pre-trained algorithms over generic frameworks. Over the forecast horizon, algorithm explainability and carbon-aware coding techniques will gain prominence as enterprises scrutinize model footprints alongside model outputs.
The Sustainability Market is Segmented by Component (Solutions and Services), by Technology (Internet of Things, and Others), by Application (Green Building, and Others), by End-User Industry (Manufacturing, and Others), by Organization Size (Large Enterprises, and Others), and by Geography (North America, South America, Europe, Asia-Pacific, and Middle East and Africa). The Market Forecasts are Provided in Terms of Value (USD).
Geography Analysis
North America generated 35.02% of 2025 revenue, reaffirming its position as the largest regional contributor to the sustainability market. Federal disclosure rules that cover investment advisers and government contractors have extended compliance obligations into sectors that previously treated sustainability as peripheral. State mandates in California and New York reinforce momentum, compelling multi-state corporations to consolidate reporting under unified platforms. The region already owns extensive cloud infrastructure and hosts leading software vendors, shortening deployment lead times. Strategic initiatives, such as hyperscaler data centers powered by renewable energy, highlight how domestic technology ecosystems accelerate positive feedback between policy and innovation. Venture-funded start-ups focusing on methane-capture analytics and grid-scale storage further enrich local solution diversity.
Asia-Pacific is forecast to record a 21.05% CAGR to 2031, making it the fastest-growing region within the sustainability market. National industrial policies in China, India, and Japan blend pollution control with competitiveness goals, driving factories to instrument production lines with IoT and AI. Singapore's green-finance incentives and Vietnam's renewable-energy targets illustrate how fiscal measures and regulatory roadmaps converge to stimulate enterprise adoption. The region's manufacturing concentration means even marginal efficiency gains translate into large absolute emissions reductions, reinforcing investment economics. Yet progress is uneven because small factories in Southeast Asia still face skills shortages, prompting regional development agencies to offer subsidized training and cloud credits.
Europe remains a critical pillar in the sustainability market, , propelled by the European Green Deal and the Corporate Sustainability Reporting Directive, both of which institutionalize sustainability across corporate strategy. The EU's 2024 Omnibus ESG Regulation seeks to cut overlapping disclosure requirements by 25%, catalyzing demand for software that can harmonize datasets across legacy and new frameworks. European enterprises experiment with blockchain traceability for consumer goods, transforming supply-chain audits into marketing differentiators. Utility firms expand smart-grid pilots to absorb growing volumes of distributed renewables, exemplifying systemic approaches that combine environmental targets with energy-security objectives. As regulatory clarity improves, market participants anticipate a second investment wave focused on circular-economy analytics and scope-3 transportation modules.
- Schneider Electric
- Microsoft
- IBM
- NEC Corporation
- SAP SE
- Salesforce
- Wolters Kluwer (Enablon)
- Sphera Solutions
- Johnson Controls
- Brambles
- SGS SA
- Morningstar Sustainalytics
- Telefonica
- Deloitte
- EY
- Sanofi
- NRI*
Additional Benefits:
- The market estimate (ME) sheet in Excel format
- 3 months of analyst support
TABLE OF CONTENTS
1 Introduction
- 1.1 Study Assumptions & Market Definition
- 1.2 Scope of the Study
2 Research Methodology
3 Executive Summary
4 Market Landscape
- 4.1 Market Overview
- 4.2 Market Drivers
- 4.2.1 Mandatory ESG-Reporting Regulations (EU CSRD, SEC) Accelerating Solution Uptake
- 4.2.2 Net-Zero Commitments Driving Carbon Accounting Demand in North America
- 4.2.3 Sustainability-Linked Financing Pushing Adoption in APAC Manufacturing
- 4.2.4 AI-Led Resource-Efficiency Gains in Heavy Industries (JP, DE)
- 4.2.5 Blockchain-Enabled Ethical Traceability Boosting Retail & Fashion
- 4.2.6 Nature-Based Offset Surge in Brazil Creating Data-Management Needs
- 4.3 Market Restraints
- 4.3.1 Fragmented Standards Causing Data-Interoperability Issues
- 4.3.2 Skilled-Talent Shortage in SE-Asia SMEs
- 4.3.3 High TCO of Industrial IoT in South America
- 4.3.4 Greenwashing Litigation Risk in the US
- 4.4 Value / Supply-Chain Analysis
- 4.5 Regulatory Outlook
- 4.6 Technological Outlook
- 4.7 Industry Attractiveness - Porter's Five Forces
- 4.7.1 Threat of New Entrants
- 4.7.2 Bargaining Power of Buyers
- 4.7.3 Bargaining Power of Suppliers
- 4.7.4 Threat of Substitutes
- 4.7.5 Competitive Rivalry
- 4.8 Geopolitics Impact Assessment
5 Market Size & Growth Forecasts (Value, USD Bn)
- 5.1 By Component
- 5.1.1 Solutions
- 5.1.2 Services
- 5.2 By Technology
- 5.2.1 Internet of Things (IoT)
- 5.2.2 AI & Analytics
- 5.2.3 Digital Twin
- 5.2.4 Cloud Computing
- 5.2.5 Blockchain
- 5.3 By Application
- 5.3.1 Green Building
- 5.3.2 Carbon Footprint Management
- 5.3.3 Air & Water Pollution Monitoring
- 5.3.4 Weather Monitoring & Forecasting
- 5.3.5 Fire Detection
- 5.3.6 Crop Monitoring
- 5.3.7 Soil & Forest Monitoring
- 5.4 By End-User Industry
- 5.4.1 Manufacturing
- 5.4.2 Energy & Utilities
- 5.4.3 Transport & Logistics
- 5.4.4 Consumer Goods & Retail
- 5.4.5 Healthcare & Life Sciences
- 5.4.6 BFSI
- 5.4.7 ICT & Telecom
- 5.4.8 Others
- 5.5 By Organization Size
- 5.5.1 Large Enterprises
- 5.5.2 Small & Mid-Sized Enterprises
- 5.6 By Deployment Mode
- 5.6.1 Cloud
- 5.6.2 On-Premise
- 5.7 By Geography
- 5.7.1 North America
- 5.7.1.1 United States
- 5.7.1.2 Canada
- 5.7.1.3 Mexico
- 5.7.2 South America
- 5.7.2.1 Brazil
- 5.7.2.2 Argentina
- 5.7.2.3 Peru
- 5.7.2.4 Rest of South America
- 5.7.3 Europe
- 5.7.3.1 United Kingdom
- 5.7.3.2 Germany
- 5.7.3.3 France
- 5.7.3.4 Italy
- 5.7.3.5 Spain
- 5.7.3.6 BENELUX (Belgium, Netherlands, and Luxembourg)
- 5.7.3.7 NORDICS (Denmark, Finland, Iceland, Norway, and Sweden)
- 5.7.3.8 Rest of Europe
- 5.7.4 Asia-Pacific
- 5.7.4.1 China
- 5.7.4.2 India
- 5.7.4.3 Japan
- 5.7.4.4 Australia
- 5.7.4.5 South Korea
- 5.7.4.6 ASEAN (Indonesia, Thailand, Philippines, Malaysia, Vietnam)
- 5.7.4.7 Rest of Asia-Pacific
- 5.7.5 Middle East and Africa
- 5.7.5.1 Saudi Arabia
- 5.7.5.2 United Arab Emirates
- 5.7.5.3 Qatar
- 5.7.5.4 Kuwait
- 5.7.5.5 Turkey
- 5.7.5.6 Egypt
- 5.7.5.7 South Africa
- 5.7.5.8 Nigeria
- 5.7.5.9 Rest of Middle East and Africa
- 5.7.1 North America
6 Competitive Landscape
- 6.1 Market Concentration
- 6.2 Strategic Moves
- 6.3 Market Share Analysis
- 6.4 Company Profiles (includes Global-level Overview, Market-level Overview, Core Segments, Financials, Strategic Info, Market Rank/Share, Products & Services, Recent Developments)
- 6.4.1 Schneider Electric
- 6.4.2 Microsoft
- 6.4.3 IBM
- 6.4.4 NEC Corporation
- 6.4.5 SAP SE
- 6.4.6 Salesforce
- 6.4.7 Wolters Kluwer (Enablon)
- 6.4.8 Sphera Solutions
- 6.4.9 Johnson Controls
- 6.4.10 Brambles
- 6.4.11 SGS SA
- 6.4.12 Morningstar Sustainalytics
- 6.4.13 Telefonica
- 6.4.14 Deloitte
- 6.4.15 EY
- 6.4.16 Sanofi
- 6.4.17 NRI*
7 Market Opportunities & Future Outlook
- 7.1 White-Space & Unmet-Need Assessment

