
PUBLISHER: Mordor Intelligence | PRODUCT CODE: 2043830

PUBLISHER: Mordor Intelligence | PRODUCT CODE: 2043830
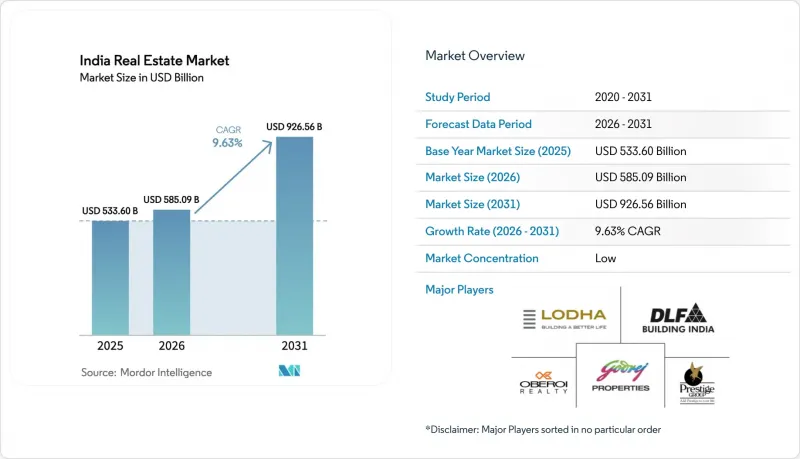
India Real Estate - Market Share Analysis, Industry Trends & Statistics, Growth Forecasts (2026 - 2031)
The India real estate market size is USD 585.09 billion in 2026 and is forecast to reach USD 926.56 billion by 2031 at a 9.63% CAGR.
Growth in the India real estate market is led by stronger corporate leasing, rising institutional ownership through REITs, and the continued expansion of Global Capability Centers that favor long-term leases in technology and business services hubs. Liquidity depth has improved at the top end of the market as listed REITs scaled assets, distributions, and untapped debt capacity, which supports acquisition-led expansion without equity dilution. Residential demand remains steady in better-connected micro-markets where metro and highway projects are unlocking new corridors, while affordability constraints at entry price points are pushing some buyers toward rentals or peripheral locations. Industrial and logistics leasing has set new records as e-commerce, third-party logistics, and overseas manufacturers increase space take-up to serve national distribution and export-linked production.
India Real Estate Market Trends and Insights
GCC/IT-ITeS Expansion and Manufacturing/Warehousing Growth Fueling Commercial and Industrial Demand
Global Capability Centers are reshaping net absorption, with their share of office demand projected at 40% in 2025 as technology and research mandates expand footprints in Bengaluru, Hyderabad, and Chennai. India's office market is expected to record 40 to 45 million square feet of net absorption in 2025, led by the top metros with balanced contributions from Bengaluru, Delhi NCR, Mumbai, Hyderabad, and Chennai. Industrial and logistics leasing reached 27.1 million square feet in H1 2025, up 63% year over year, with e-commerce operators lifting their share to 25% and foreign corporates accounting for 43% of Q2 2025 space take-up. Manufacturers plan to scale operations and expand into Tier-2 and Tier-3 cities over the next two to three years, and policymakers earmarked funding for plug-and-play parks to support faster set-up. Collectively, these forces underpin a durable leasing cycle across offices, warehouses, and ancillary assets in the India real estate market.
Urbanization and Rising Incomes Driving Housing Demand Across Metros and Growth Corridors
Urbanization and income growth continue to reshape residential absorption in India's top cities, with demand tilting toward employment-rich corridors and well-connected suburban nodes. The urban population is projected to reach 600 million by 2030, and this shift is visible in the concentration of new launches and sales in metro-adjacent growth corridors. Inventory rotation is improving in markets where developers calibrate launches to match premium demand, as seen in Pune's quarters-to-sell levels that have hovered near cycle lows. Affordability pressure at lower ticket sizes is pushing some first-time buyers toward rentals and peripheral locations, while higher-income households continue to lead sales in premium projects near transit and job hubs. New metro lines and expressways are reinforcing this pattern by shortening commutes and linking residential catchments to CBDs and airports, which sustains pricing resilience in select micro-markets. The result is a more segmented India real estate market where premium and mid-income stock turn faster, while sub-USD 120,000 housing remains supply-constrained in Tier-1 cores.
Land Acquisition, Approvals, and Compliance Timelines Delaying Project Execution
Land aggregation, land-use conversion, and multi-agency approvals can stretch project timelines beyond developer cash-flow tolerances in dense metros. Insolvency resolution has been slow, with average CIRP closures at 713 days as of March 2025, which is well beyond statutory timelines and increases the cost of capital. Maharashtra's RERA authority suspended registrations of 1,905 housing projects for non-compliance and directed remedies for homebuyers, which raises the execution bar for developers with weaker balance sheets. Uttar Pradesh has eased farmland conversion for some residential schemes by allowing local authorities to approve certain transitions from agricultural to residential use, which can speed up select projects. Courts have also nudged stricter accountability, including interest parity for delayed possession relative to penalties charged to buyers, which feeds into feasibility models and risk pricing. These constraints slow supply velocity in the India real estate market, especially in land-scarce corridors where approvals remain complex.
Other drivers and restraints analyzed in the detailed report include:
- Home Loan Availability and Stable EMIs Supporting Affordable and Mid-Income Segments
- Regulatory Reforms and Formalization Improving Transparency and Investor Confidence
- Construction Cost Escalation and Funding Constraints for Smaller Developers
For complete list of drivers and restraints, kindly check the Table Of Contents.
Segment Analysis
Sales accounted for 69.5% of the India real estate market size in 2025. The Rental segment is projected to be the fastest-growing at a 10.99% CAGR through 2031, which reflects a broad institutional shift toward stabilized, income-generating assets across offices, retail, warehousing, and emerging alternative asset classes. GCC-rich office markets prefer long-duration leases to limit balance sheet risk, and these preferences are set to hold as MNCs scale R&D and tech hubs. Logistics and warehousing users are increasingly opting for build-to-suit agreements that match network optimization needs as e-commerce operators lifted their share of industrial leasing to 25% in H1 2025. Across operational portfolios, listed REITs reported near-91% occupancy in September 2025 and distribution yields in the 6% to 7% range in FY 2025, which signals durable rental cash flows that support incremental allocations. These income characteristics underpin the steady institutionalization of the leasing model in the India real estate market.
The availability of untapped debt capacity at listed REITs, estimated near INR 230 billion (USD 2.8 billion), supports acquisition-led growth without equity dilution, while strong capital market access has enabled marquee transactions and QIPs. Recent examples include Brookfield India REIT's acquisition of a 50% stake in a 3.3 million square foot North Commercial Portfolio for INR 12.28 billion (USD 148.0 million) and a follow-on raise of INR 47 billion (USD 566.3 million) that broadened the investor base. On the Sales side, top-listed developers delivered record bookings in calendar 2024, with Godrej Properties reporting INR 28,800 crore (USD 3.5 billion) of sales on the back of active land acquisition and joint development agreements. At the same time, insolvency and approval timelines continue to raise execution risk for sales-led projects, which sustains investor preference for leased and stabilized assets. The balance of these factors supports the Rental segment's status as the structural growth leader in the India real estate market over the forecast period.
The India Real Estate Market Report is Segmented by Business Model (Sales and Rental), by Property Type (Residential and Commercial), by End-User (Individuals/Households, Corporates & SMEs and Others), and by City (Mumbai Metropolitan Region, Delhi NCR, Pune, Bengaluru, Hyderabad, Chennai, Kolkata, Ahmedabad, and the Rest of India). The Market Forecasts are Provided in Terms of Value (USD).
List of Companies Covered in this Report:
- DLF Ltd
- Godrej Properties Ltd
- Macrotech Developers (Lodha)
- Prestige Estates Projects
- Oberoi Realty
- Sobha Ltd
- Brigade Enterprises
- Puravankara Ltd
- Mahindra Lifespace Developers
- Tata Realty & Infrastructure / Tata Housing
- L&T Realty
- Kolte-Patil Developers
- Sunteck Realty
- Hiranandani Group
- Signature Global (India)
- Shriram Properties
- Phoenix Mills (retail)
- Embassy Office Parks REIT
- Mindspace Business Parks REIT
- Brookfield India Real Estate Trust
- Nexus Select Trust (Retail REIT)
- K Raheja Corp
- RMZ Corp
Additional Benefits:
- The market estimate (ME) sheet in Excel format
- 3 months of analyst support
TABLE OF CONTENTS
1 Introduction
- 1.1 Study Assumptions & Market Definition
- 1.2 Scope of the Study
2 Research Methodology
3 Executive Summary
4 Market Landscape
- 4.1 Overview of the Economy and Market
- 4.2 Real Estate Buying Trends - Socioeconomic and Demographic Insights
- 4.3 Regulatory Outlook
- 4.4 Technological Outlook
- 4.5 Focus on Technology Innovation, Startups, and PropTech in Real Estate
- 4.6 Insights into Rental Yields in Real Estate Segment
- 4.7 Real Estate Lending Dynamics
- 4.8 Insights Into Affordable Housing Support Provided by Government and Public-private Partnerships
- 4.9 Market Drivers
- 4.9.1 Urbanization and rising incomes driving housing demand across metros and growth corridors
- 4.9.2 Regulatory reforms (e.g., RERA) and formalization improving transparency and investor confidence
- 4.9.3 Home loan availability and stable EMIs supporting affordable and mid-income segments
- 4.9.4 GCC/IT-ITeS expansion and manufacturing/warehousing growth fueling commercial and industrial demand
- 4.9.5 REITs and institutional capital deepening liquidity and exit avenues
- 4.10 Market Restraints
- 4.10.1 Land acquisition, approvals, and compliance timelines delaying project execution
- 4.10.2 Construction cost escalation and funding constraints for smaller developers
- 4.10.3 Affordability pressures in Tier-1 cities limiting absorption at higher price points
- 4.11 Value/Supply-Chain Analysis
- 4.11.1 Overview
- 4.11.2 Real estate developers & Contractors - key Quantitative and Qualitative insights
- 4.11.3 Real estate brokers and agents - key quantittive and qualittive insights
- 4.11.4 Property management companies -- key quantitative and qualitive insights
- 4.11.5 Insights on Valuation Advisory and Other Real Estate Services
- 4.11.6 State of the building materials industry and partnerships with key developers
- 4.11.7 Insights on key strategic real estate investors/buyers in the market
- 4.12 Porter's Five Forces
- 4.12.1 Bargaining Power of Suppliers
- 4.12.2 Bargaining Power of Buyers
- 4.12.3 Threat of New Entrants
- 4.12.4 Threat of Substitutes
- 4.12.5 Intensity of Competitive Rivalry
5 Real Estate Market Size & Growth Forecasts (Value)
- 5.1 Sales
- 5.2 Rental
6 Real Estate Market (Sales Model) Size & Growth Forecasts (Value)
- 6.1 By Property Type
- 6.1.1 Residential
- 6.1.1.1 Apartments and Condominiums
- 6.1.1.2 Villas and Landed Houses
- 6.1.2 Commercial
- 6.1.2.1 Office
- 6.1.2.2 Retail
- 6.1.2.3 Logistics
- 6.1.2.4 Others
- 6.1.1 Residential
- 6.2 By End-user
- 6.2.1 Individuals/Households
- 6.2.2 Corporates & SMEs
- 6.2.3 Others
- 6.3 By Cities
- 6.3.1 Mumbai Metropolitan Region
- 6.3.2 Delhi NCR
- 6.3.3 Pune
- 6.3.4 Bengaluru
- 6.3.5 Hyderabad
- 6.3.6 Chennai
- 6.3.7 Kolkata
- 6.3.8 Ahmedabad
- 6.3.9 Rest of India
7 Competitive Landscape
- 7.1 Market Concentration
- 7.2 Strategic Moves
- 7.3 Market Share Analysis
- 7.4 Company Profiles {(includes Global level Overview, Market level overview, Core Segments, Financials as available, Strategic Information, Market Rank/Share for key companies, Products & Services, and Recent Developments)}
- 7.4.1 DLF Ltd
- 7.4.2 Godrej Properties Ltd
- 7.4.3 Macrotech Developers (Lodha)
- 7.4.4 Prestige Estates Projects
- 7.4.5 Oberoi Realty
- 7.4.6 Sobha Ltd
- 7.4.7 Brigade Enterprises
- 7.4.8 Puravankara Ltd
- 7.4.9 Mahindra Lifespace Developers
- 7.4.10 Tata Realty & Infrastructure / Tata Housing
- 7.4.11 L&T Realty
- 7.4.12 Kolte-Patil Developers
- 7.4.13 Sunteck Realty
- 7.4.14 Hiranandani Group
- 7.4.15 Signature Global (India)
- 7.4.16 Shriram Properties
- 7.4.17 Phoenix Mills (retail)
- 7.4.18 Embassy Office Parks REIT
- 7.4.19 Mindspace Business Parks REIT
- 7.4.20 Brookfield India Real Estate Trust
- 7.4.21 Nexus Select Trust (Retail REIT)
- 7.4.22 K Raheja Corp
- 7.4.23 RMZ Corp
8 Market Opportunities & Future Outlook
- 8.1 White-space & unmet-need assessment

