
PUBLISHER: Mordor Intelligence | PRODUCT CODE: 2043980

PUBLISHER: Mordor Intelligence | PRODUCT CODE: 2043980
United States Real Estate Services - Market Share Analysis, Industry Trends & Statistics, Growth Forecasts (2026 - 2031)
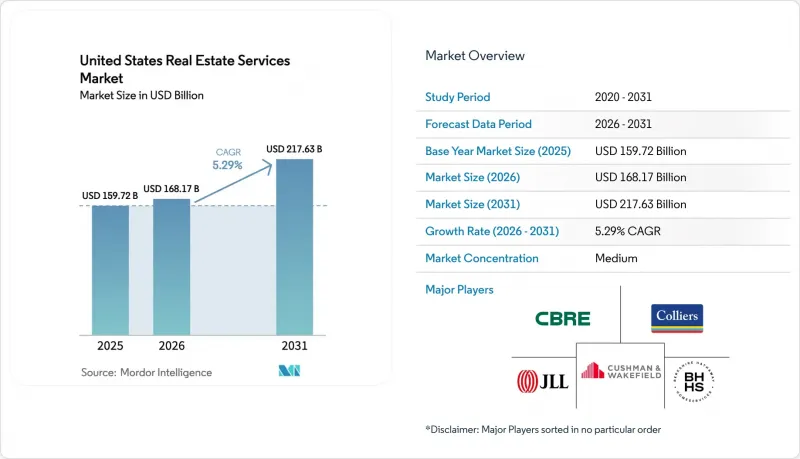
The United States Real Estate Services Market size is expected to grow from USD 159.72 billion in 2025 to USD 168.17 billion in 2026 and is forecast to reach USD 217.63 billion by 2031 at 5.29% CAGR over 2026-2031.
Residential transactions still dominate fee income, yet institutional outsourcing and technology adoption are shifting the revenue mix toward higher-margin management and advisory work. Institutional investors are reallocating operating budgets toward third-party specialists to gain access to analytics platforms, while build-to-rent portfolios are scaling quickly and require centralized oversight. Brokerage models are under price pressure after the Sitzer-Burnett settlement, and firms that cannot prove differentiated service are losing listings to flat-fee competitors. Mortgage rates have eased from their 2024 peaks, unlocking pent-up buyer demand, but the lingering lock-in effect keeps existing-home supply tight. Companies that bundle brokerage, management, and mortgage solutions are gaining market share because clients want a single accountable provider.
United States Real Estate Services Market Trends and Insights
Institutional Investors Increasing Outsourcing to Property and Asset Managers
Large investors are shifting real estate operations from internal teams to specialized third-party managers, which broadens the revenue pool for full-service providers. A 2025 industry survey showed that 61% of firms plan to partner with external managers to gain access to modern data platforms they cannot cost-effectively build on their own. Roughly half of institutional investors already outsource fund administration, and about three-quarters of the rest are evaluating that option. This trend is most visible in complex asset classes such as office conversions and logistics facilities, where seasoned operators can raise net operating income through tenant-experience technology. Some leading service providers have completed "lift-out" deals that move entire in-house teams to the vendor while preserving expertise. Managers who pair integrated software with deep sector knowledge are positioned to win a large share of this outsourcing wave, while generalist firms risk lower margins.
Growth in Build-to-Rent and Single-Family Rentals Expanding Management Volumes
Build-to-rent single-family housing has moved from a niche strategy to a reliable growth engine for property managers. The National Association of Realtors reported that completions in this format reached 90,000 units in 2024, up from 60,000 in 2021, and now represent 8.1% of all single-family starts. CBRE places the national inventory near 350,000 units and expects institutional owners to expand portfolios by 50% within three years. A January 2025 federal order that eased certain zoning limits accelerated permitting and attracted an estimated USD 60 billion of new capital. Purpose-built BTR communities include centralized leasing offices and technology-enabled tenant services, which create steady fee income that is less volatile than brokerage commissions. A potential risk emerges if large owners choose to manage operations in-house once scale is reached, which could trim third-party demand in more mature regions.
Transaction Slowdowns from High Mortgage Rates Reducing Brokerage Revenues
Elevated borrowing costs kept many owners from listing properties because they hold mortgages below 4%. The Federal Housing Finance Agency estimates that this "lock-in" trimmed existing-home transactions by up to 1.7 million in 2024 compared with pre-pandemic norms. Although the average rate eased to 6.01% in February 2026, it still doubles early-2022 levels. Brokerages with high fixed costs and limited diversification feel the squeeze most. NAR confirms that 2024 unit sales stayed near multi-decade lows on a per-capita basis, cutting agent income and driving professionals to leave the field. Firms that shift mix toward recurring management fees and advisory work stand on firmer ground during volume slumps.
Other drivers and restraints analyzed in the detailed report include:
- Strong Demand for Valuation, Appraisal, and Advisory for Financing and Compliance
- Adoption of Digital Leasing, E-Sign, and AI-Enabled Brokerage or Marketing Tools
- Commission and Fee Compression from Litigation, Regulation, and Alternative Models
For complete list of drivers and restraints, kindly check the Table Of Contents.
Segment Analysis
Residential services held 53.1% of 2025 revenue in the United States real estate services market. Commercial assets are forecast to grow 5.77% annually through 2031, powered by investor appetite for logistics, life-science office, and mixed-use conversion projects. Build-to-rent portfolios are expanding fastest, with CBRE projecting 50% growth in inventory by 2027. Property managers who can integrate smart-building sensors and predictive maintenance unlock higher net operating income, an advantage that keeps renewal rates high. Office turnaround work converting class B towers into residential or hotel uses creates complex advisory assignments that favor multidisciplinary firms.
As e-commerce firms pursue next-day delivery, logistics landlords demand tight service-level agreements on facility uptime, pushing management fees above historical averages. Multifamily retains steady momentum, but Sun Belt oversupply is moderating rent growth, reinforcing the need for advanced revenue-management software. Retail assets emphasize experiential design and grocery anchors, maintaining solid occupancy even as enclosed malls retrench. Providers that offer sector-specific talent pools and data analytics capture the lion's share of cross-selling opportunities, while generalist competitors lose mandates to specialists.
The United States Real Estate Services Market Report is Segmented by Property Type (Residential, Commercial), by Service (Brokerage, Property Management, Valuation, Others), by Client Type (Individuals/Households, Corporates & SMEs, Others), and by State (Texas, California, Florida, New York, Illinois, Rest of US). Market Forecasts are Provided in Terms of Value (USD).
List of Companies Covered in this Report:
- CBRE Group Inc.
- Jones Lang LaSalle (JLL)
- Cushman & Wakefield plc
- Colliers International Group Inc.
- Berkshire Hathaway HomeServices
- RE/MAX LLC
- Keller Williams Realty Inc.
- Zillow Group Inc.
- Redfin Corporation
- Marcus & Millichap Inc.
- Howard Hanna Real Estate Services
- Century 21 Real Estate LLC
- eXp Realty LLC
- Douglas Elliman Inc.
- Transwestern Commercial Services LLC
- SVN International Corp.
- Hines Interests LP
- Greystar Real Estate Partners LLC
- Prologis Inc.
- Brookfield Properties
Additional Benefits:
- The market estimate (ME) sheet in Excel format
- 3 months of analyst support
TABLE OF CONTENTS
1 Introduction
- 1.1 Study Assumptions & Market Definition
- 1.2 Scope of the Study
2 Research Methodology
3 Executive Summary
4 Market Insights and Dynamics
- 4.1 Market Overview
- 4.2 Market Drivers
- 4.2.1 Institutional investors increasing outsourcing to property and asset managers
- 4.2.2 Growth in build-to-rent and single-family rentals expanding management volumes
- 4.2.3 Strong demand for valuation, appraisal, and advisory for financing and compliance
- 4.2.4 Adoption of digital leasing, e-sign, and AI-enabled brokerage/marketing tools
- 4.2.5 Rising O&M complexity in commercial buildings boosting facilities and REFM services
- 4.3 Market Restraints
- 4.3.1 Transaction slowdowns from high mortgage rates reducing brokerage revenues
- 4.3.2 Commission and fee compression from litigation, regulation, and alternative models
- 4.3.3 Labor shortages and wage inflation for property management and maintenance roles
- 4.4 Value / Supply-Chain Analysis
- 4.5 Regulatory Landscape
- 4.6 Technological Outlook
- 4.7 Porter's Five Forces
- 4.7.1 Bargaining Power of Suppliers
- 4.7.2 Bargaining Power of Consumers
- 4.7.3 Threat of New Entrants
- 4.7.4 Threat of Substitutes
- 4.7.5 Intensity of Competitive Rivalry
- 4.8 Pricing Analysis
5 Market Size & Growth Forecasts (Value USD)
- 5.1 By Property Type
- 5.1.1 Residential
- 5.1.1.1 Single-Family
- 5.1.1.2 Multi-Family
- 5.1.2 Commercial
- 5.1.2.1 Office
- 5.1.2.2 Retail
- 5.1.2.3 Logistics
- 5.1.2.4 Others
- 5.1.1 Residential
- 5.2 By Service
- 5.2.1 Brokerage Services
- 5.2.2 Property Management Services
- 5.2.3 Valuation Services
- 5.2.4 Others
- 5.3 By Client Type
- 5.3.1 Individuals / Households
- 5.3.2 Corporates & SMEs
- 5.3.3 Others
- 5.4 By State
- 5.4.1 Texas
- 5.4.2 California
- 5.4.3 Florida
- 5.4.4 New York
- 5.4.5 Illinois
- 5.4.6 Rest of US
6 Competitive Landscape
- 6.1 Market Concentration
- 6.2 Strategic Moves
- 6.3 Market Share Analysis
- 6.4 Company Profiles {(includes Global level Overview, Market level overview, Core Segments, Financials as available, Strategic Information, Products & Services, and Recent Developments)}
- 6.4.1 CBRE Group Inc.
- 6.4.2 Jones Lang LaSalle (JLL)
- 6.4.3 Cushman & Wakefield plc
- 6.4.4 Colliers International Group Inc.
- 6.4.5 Berkshire Hathaway HomeServices
- 6.4.6 RE/MAX LLC
- 6.4.7 Keller Williams Realty Inc.
- 6.4.8 Zillow Group Inc.
- 6.4.9 Redfin Corporation
- 6.4.10 Marcus & Millichap Inc.
- 6.4.11 Howard Hanna Real Estate Services
- 6.4.12 Century 21 Real Estate LLC
- 6.4.13 eXp Realty LLC
- 6.4.14 Douglas Elliman Inc.
- 6.4.15 Transwestern Commercial Services LLC
- 6.4.16 SVN International Corp.
- 6.4.17 Hines Interests LP
- 6.4.18 Greystar Real Estate Partners LLC
- 6.4.19 Prologis Inc.
- 6.4.20 Brookfield Properties
7 Market Opportunities & Future Outlook
- 7.1 White-space & Unmet-Need Assessment

