PUBLISHER: Mordor Intelligence | PRODUCT CODE: 2043883

PUBLISHER: Mordor Intelligence | PRODUCT CODE: 2043883
ASEAN Sulfur - Market Share Analysis, Industry Trends & Statistics, Growth Forecasts (2026 - 2031)
The ASEAN Sulfur Market size is expected to grow from 1.85 Million metric tons in 2025 to 1.89 Million metric tons in 2026 and is forecast to reach 2.12 Million metric tons by 2031 at 2.32% CAGR over 2026-2031.
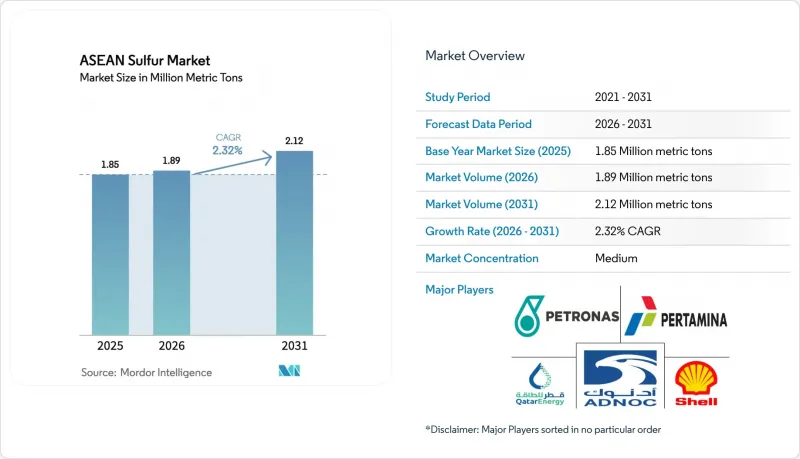
Indonesia's increase in nickel high-pressure acid leach projects, constrained Middle-East supply routes, and stricter refinery desulfurization standards are altering trade flows and emphasizing the strategic value of captive acid capacity. While Middle-East exporters continue to lead in seaborne deliveries, vertical integration by Indonesian nickel producers and regional refiners is reducing dependence on imports by strengthening domestic supply. Additionally, Vietnam's phosphate fertilizer expansions and Thailand's stable ammonium-sulfate demand are supporting consistent agricultural consumption. These factors collectively maintain the ASEAN sulfur market in a structural deficit, despite limited overall demand growth.
ASEAN Sulfur Market Trends and Insights
Fertilizer Demand Rebound Across ASEAN Rice and Oil-Seed Belts
Southeast Asian growers increased fertilizer usage to 5.5 million tons in 2024, driven by higher crop prices and government subsidies that boosted application rates. The production of one ton of phosphoric acid requires nearly the same weight of sulfur, directly linking increased phosphate output to the ASEAN sulfur market. Ammonium sulfate, which contains 24% sulfur, averaged THB 11,139 per ton in Thailand during 2024 and remained a preferred fertilizer for rice and oil-seed rotations. Vietnam's fertilizer consumption is growing, with the Mekong Delta's rice paddies accounting for nearly 40% of national demand. This growth pattern suggests localized sulfur shortages may emerge first in areas with new phosphate production capacity, exacerbating price volatility during disruptions in Middle Eastern logistics. Import dependency remains significant, with 24% of Thailand's ammonium sulfate sourced from Saudi Arabia in early 2025, leaving the ASEAN sulfur market vulnerable to global freight fluctuations.
Nickel-HPAL Projects in Indonesia and the Philippines Intensifying Sulfuric-Acid Pull
Indonesia increased mixed-hydroxide-precipitate (MHP) capacity to 850,000 tons of nickel in 2025, with each ton requiring approximately 11.8 tons of sulfur for HPAL (high-pressure acid leaching) processes. As a result, sulfuric acid demand surged from 5.17 million tons in 2024 to 7.12 million tons in 2025, marking a 40% increase that significantly impacted the ASEAN sulfur market. Sulfur now accounts for nearly 29% of HPAL operating costs when spot prices exceed USD 530 per ton. Producers have responded by installing on-site burners to convert elemental sulfur, reducing reliance on imported acid. In 2024, Tsingshan added approximately 5 million tons per year of new acid capacity, while QMB commissioned 660,000 tons per year, with an additional 1 million tons per year planned. This vertical integration is shifting trade flows from finished sulfuric acid to elemental sulfur, driving a 48% year-on-year increase in Indonesian sulfur imports to 5.35 million tons in 2025.
Volatile Middle-East Supply Routes Via Strait of Hormuz and Red Sea
The March 2024 closure of the Strait of Hormuz disrupted nearly half of global seaborne sulfur supply and caused freight costs to double due to conflict-related surcharges. By December 2025, Indonesia's CIF sulfur price had surged to USD 547 per ton, representing a 193% increase that significantly compressed HPAL margins. Furthermore, Russia's export ban in November 2025 removed an alternative supply source, while China's price-cap policy redirected domestic sulfur away from exports. With approximately 75% of Indonesian sulfur imports originating from the Gulf, each supply disruption adds price premiums, impacting the ASEAN sulfur market and encouraging further investment in captive-burner projects.
Other drivers and restraints analyzed in the detailed report include:
- Stricter Refinery Desulfurization Standards Boosting Regional Sulfur Recovery
- Expansion of Phosphate-Fertilizer Capacities in Vietnam and Thailand
- Growing Adoption of Sulfate-Free LiFePO4 Battery Chemistries
For complete list of drivers and restraints, kindly check the Table Of Contents.
Segment Analysis
Standard Grade sulfur accounted for 84.27% of the projected 2025 volume, maintaining its position as the primary feedstock for fertilizers, base chemicals, and nickel HPAL leach circuits. High-Purity sulfur is anticipated to grow at a CAGR of 3.41% through 2031, driven by increased pharmaceutical production in Singapore and initial battery-material trials in Malaysia. Suppliers utilizing advanced Claus or wet-acid plants can enhance off-gas streams, improving realizations without expanding primary mining capacity.
In 2024, rubber industries in Vietnam and Thailand consumed approximately 250,000 tons of insoluble sulfur for tire vulcanization. Despite a 13% increase in feedstock prices, alternative curing methods like peroxide and radiation remain niche due to performance limitations. The Asia-Pacific region accounts for 55% of global insoluble sulfur consumption, ensuring stable demand even during economic slowdowns. While High-Purity sulfur cannot replace Standard Grade in these applications, increased captive burning in Indonesia may divert Standard Grade sulfur away from rubber processors, potentially tightening regional supply and supporting prices.
The ASEAN Sulfur Market Report is Segmented by Purity (Standard Grade >=99. 5% and High-Purity >=99. 9%), End-User Industry (Fertilizer, Chemical Processing, Metal Manufacturing, Rubber Processing, and Other End-User Industries), and Geography (Malaysia, Indonesia, Thailand, Singapore, Philippines, Vietnam, and Rest of ASEAN Countries). The Market Forecasts are Provided in Terms of Volume (Metric Tons).
List of Companies Covered in this Report:
- Abu Dhabi National Oil Company (ADNOC)
- China Petroleum & Chemical Corporation (SINOPEC)
- Enersul Ltd
- H.J. Baker & Bro., LLC
- Indian Oil Corporation Ltd.
- Petroliam Nasional Berhad (PETRONAS)
- PETROVIETNAM CHEMICAL AND SERVICES CORPORATION (PVDMC)
- PT Candi Ngrimbi
- PT Pertamina (Persero)
- Qatar Petroleum for the Sale of Petroleum Products Company Limited
- QatarEnergy
- Saudi Aramco
- Shell plc
- Suncor Energy Inc.
- Yara International
Additional Benefits:
- The market estimate (ME) sheet in Excel format
- 3 months of analyst support
TABLE OF CONTENTS
1 Introduction
- 1.1 Study Assumptions and Market Definition
- 1.2 Scope of the Study
2 Research Methodology
3 Executive Summary
4 Market Landscape
- 4.1 Market Overview
- 4.2 Market Drivers
- 4.2.1 Fertilizer demand rebound across ASEAN rice and oil-seed belts
- 4.2.2 Nickel-HPAL projects in Indonesia and Philippines intensifying sulfuric-acid pull
- 4.2.3 Stricter refinery desulfurization standards boosting regional sulfur recovery
- 4.2.4 Expansion of phosphate-fertilizer production capacities in Vietnam and Thailand
- 4.2.5 Rise of sulfur-based cathode RandD for low-cost grid batteries
- 4.3 Market Restraints
- 4.3.1 Volatile Middle-East supply routes via Strait of Hormuz and Red Sea
- 4.3.2 Growing adoption of sulfate-free LiFePO4 battery chemistries
- 4.3.3 Tightening ASEAN port dust-emission limits raising handling costs
- 4.4 Value Chain Analysis
- 4.5 Porter's Five Forces
- 4.5.1 Bargaining Power of Suppliers
- 4.5.2 Bargaining Power of Consumers
- 4.5.3 Threat of New Entrants
- 4.5.4 Threat of Substitutes
- 4.5.5 Degree of Competition
5 Market Size and Growth Forecasts (Volume)
- 5.1 By Purity
- 5.1.1 Standard Grade (>= 99.5%)
- 5.1.2 High-Purity (>= 99.9%, pharma/battery)
- 5.2 By End-user Industry
- 5.2.1 Fertilizer
- 5.2.2 Chemical Processing
- 5.2.3 Metal Manufacturing
- 5.2.4 Rubber Processing
- 5.2.5 Other End-user Industries
- 5.3 By Geography
- 5.3.1 Malaysia
- 5.3.2 Indonesia
- 5.3.3 Thailand
- 5.3.4 Singapore
- 5.3.5 Philippines
- 5.3.6 Vietnam
- 5.3.7 Rest of ASEAN Countries
6 Competitive Landscape
- 6.1 Market Concentration
- 6.2 Strategic Moves
- 6.3 Market Share (%)/Ranking Analysis
- 6.4 Company Profiles (includes Global level Overview, Market level overview, Core Segments, Financials as available, Strategic Information, Products and Services, and Recent Developments)
- 6.4.1 Abu Dhabi National Oil Company (ADNOC)
- 6.4.2 China Petroleum & Chemical Corporation (SINOPEC)
- 6.4.3 Enersul Ltd
- 6.4.4 H.J. Baker & Bro., LLC
- 6.4.5 Indian Oil Corporation Ltd.
- 6.4.6 Petroliam Nasional Berhad (PETRONAS)
- 6.4.7 PETROVIETNAM CHEMICAL AND SERVICES CORPORATION (PVDMC)
- 6.4.8 PT Candi Ngrimbi
- 6.4.9 PT Pertamina (Persero)
- 6.4.10 Qatar Petroleum for the Sale of Petroleum Products Company Limited
- 6.4.11 QatarEnergy
- 6.4.12 Saudi Aramco
- 6.4.13 Shell plc
- 6.4.14 Suncor Energy Inc.
- 6.4.15 Yara International
7 Market Opportunities and Future Outlook
- 7.1 White-space and Unmet-Need Assessment

