
PUBLISHER: Mordor Intelligence | PRODUCT CODE: 2043900

PUBLISHER: Mordor Intelligence | PRODUCT CODE: 2043900
United States Automotive Engine Oils - Market Share Analysis, Industry Trends & Statistics, Growth Forecasts (2026 - 2031)
The United States Automotive Engine Oils Market size is projected to be 2.12 billion liters in 2025, 2.08 billion liters in 2026, and decline to 1.91 billion liters by 2031, declining at a CAGR of -1.7% from 2026 to 2031.
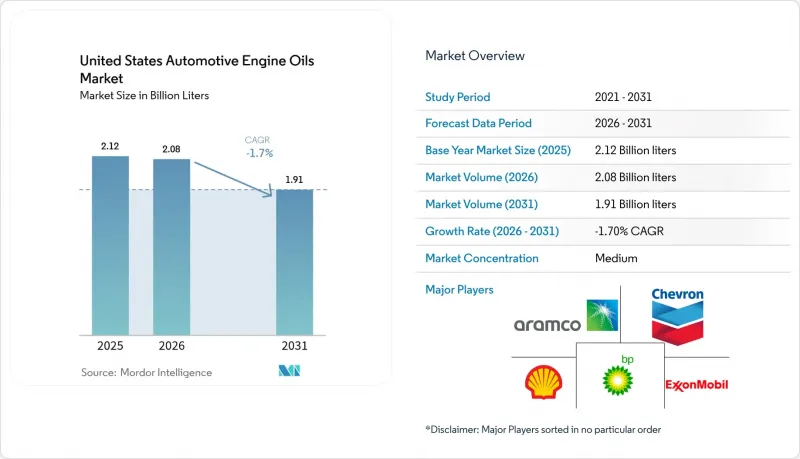
A structural shift is driving this contraction: life-of-vehicle factory-fill programs, predictive-maintenance algorithms, and ultra-low-viscosity specifications raise lubricant quality even as per-vehicle consumption falls. API SP and ILSAC GF-7 standards, introduced in March 2025, have already licensed more than 1,800 formulations that rely on costlier additive chemistries and extensive dynamometer testing. Meanwhile, Ford's Intelligent Oil-Life Monitor more than doubled the average drain interval to 10,000 miles by late 2025, and Valvoline secured Cummins approval for a 100,000-mile heavy-duty oil the same year. Although these advances elevate product margins, they also shrink the serviceable volume pool, anchoring the long-term downtrend for the United States automotive engine oils market.
United States Automotive Engine Oils Market Trends and Insights
API SP/ILSAC GF-7 Specification Roll-Out
Launched in March 2025, API SP and ILSAC GF-7 have already licensed more than 1,800 blends, yet certification backlogs of 6-9 months persist because only a handful of North American labs own the requisite Sequence IX and Sequence X stands. Each test cycle costs USD 50,000-75,000 and ties up a dynamometer for up to six weeks, favoring producers with captive facilities. Ford, General Motors, Toyota, Honda, and Stellantis mandated GF-7 for 2026 factory fills, letting certified brands capture 10-15% price premiums over legacy API SN Plus oils. As mid-tier blenders exit or co-license additive packages from Lubrizol or Infineum, volume erosion continues, but margin per litre widens, adding roughly 0.3 percentage points to the United States automotive engine oils market CAGR.
Rapid Shift to Full-Synthetic and less than or equal to 0W-20 Grades
Synthetic formulas represented close to 68% of lubricant value in 2024, with 0W-20 appearing in 42% of new-vehicle owner manuals. By 2025, more than 70% of model-year specifications called for 0W-20 or thinner, and select hybrid lines moved to 0W-16 to meet tightening EPA fleet-average CO2 ceilings of 85 g/mile by 2032. Blenders responded by investing in Group III and PAO feedstock: ExxonMobil's Singapore Resid Upgrade, commissioned early 2025, added 1.2 million ton/year of high-viscosity-index base stocks for global allocation. Although litre demand keeps falling, the synthetic share grows fast enough to contribute a net 0.4 percentage-point lift to the United States automotive engine oils market trajectory.
Base-Oil Price and Supply Volatility
Group II and Group III spot prices swayed 15-20% quarter-to-quarter during 2024-2025 because of refinery turnarounds and lighter crude slates, leaving independent blenders exposed to margin compression. Additive elements such as molybdenum and boron climbed 12-18%, further squeezing costs. US refinery additions remain unlikely under energy-transition pressure, so volatility will persist and shave around 0.4 percentage points off the United States automotive engine oils market CAGR until new Asian capacity backfills domestic shortfalls.
Other drivers and restraints analyzed in the detailed report include:
- Aging Vehicle Parc more than 12 Years Sustaining Demand
- AI-Driven Predictive-Maintenance Programs Extending Drain Intervals
- Limited GF-7 Test-Stand Capacity Delaying Certifications
For complete list of drivers and restraints, kindly check the Table Of Contents.
Segment Analysis
Passenger car motor oil accounted for 63.45% of the United States Automotive Engine Oils market size in 2025, reflecting the nation's 290 million-unit vehicle parc. Although internal-combustion cars continue to dominate the fleet, PCMO volume is forecast to fall as electrification, telematics, and factory-fill longevity reshape service patterns. Heavy-duty motor oil volumes erode more slowly because long-haul diesels remain hard to electrify and typically stay in service 15-20 years. Motorcycle engine oil shows the smallest contraction (-1.64% CAGR during the forecast period (2026-2031)) because cruiser and touring riders maintain legacy drain intervals and have limited electric alternatives.
The internal mix is also changing. Within PCMO, 0W-20 and thinner grades expand fastest, driven by OEM mandates tied to multi-pollutant standards. Conventional 10W-30 and 10W-40 grades retreat to a shrinking pool of vehicles built before 2015. HDMO mirrors this trend as fleets adopt 0W-30 or 5W-30 CK-4 oils for cold-start efficiency. Valvoline's 100,000-mile Cummins-approved HDMO illustrates how extended drains deepen litre-volume shrinkage even when product value rises.
The United States Automotive Engine Oils Market Report is Segmented by Resin Type (Passenger Car Motor Oil, Heavy Duty Motor Oil, and Motorcycle Engine Oil) and Base Stock (Mineral, Synthetic, Semi-Synthetic, and Bio-Based). The Market Forecasts are Provided in Terms of Volume (Liters).
List of Companies Covered in this Report:
- AMSOIL INC.
- Blauparts LLC
- BP p.l.c.
- Chevron Corporation
- CITGO Petroleum
- ExxonMobil Corporation
- FUCHS
- Gulf Oil International Ltd
- Idemitsu Kosan Co., Ltd.
- Liqui Moly GmbH
- Lucas Oil Products, Inc.
- Motul
- Petro-Canada Lubricants Inc.,
- Phillips 66 Lubricants
- Quaker Houghton.
- Shell plc
- TotalEnergies
- Saudi Arabian Oil Co.
Additional Benefits:
- The market estimate (ME) sheet in Excel format
- 3 months of analyst support
TABLE OF CONTENTS
1 Introduction
- 1.1 Study Assumptions and Market Definition
- 1.2 Scope of the Study
2 Research Methodology
3 Executive Summary
4 Market Landscape
- 4.1 Market Overview
- 4.2 Market Drivers
- 4.2.1 API SP/ILSAC GF-7 specification roll-out
- 4.2.2 Rapid shift to full-synthetic and <=0W-20 grades
- 4.2.3 Aging US vehicle parc >12 yrs sustaining demand
- 4.2.4 AI-driven predictive-maintenance programs extending drain intervals
- 4.2.5 OEMs' carbon-credit strategies favouring ultra-low-viscosity factory-fill
- 4.3 Market Restraints
- 4.3.1 Base-oil price and supply volatility
- 4.3.2 Limited GF-7 test-stand capacity delaying certifications
- 4.3.3 OEM factory-fill life-of-vehicle oils curbing after-market volumes
- 4.4 Value Chain Analysis
- 4.5 Regulatory Landscape
- 4.6 Porter's Five Forces
- 4.6.1 Threat of New Entrants
- 4.6.2 Bargaining Power of Suppliers
- 4.6.3 Bargaining Power of Buyers
- 4.6.4 Threat of Substitutes
- 4.6.5 Industry Rivalry
5 Market Size and Growth Forecasts (Value)
- 5.1 By Resin Type
- 5.1.1 Passenger Car Motor Oil (PCMO)
- 5.1.1.1 0W-XX
- 5.1.1.2 5W-XX
- 5.1.1.3 10W-XX
- 5.1.1.4 15W-XX
- 5.1.1.5 Monogrades
- 5.1.1.6 Other Grades
- 5.1.2 Heavy Duty Motor Oil (HDMO)
- 5.1.2.1 0W-XX
- 5.1.2.2 5W-XX
- 5.1.2.3 10W-XX
- 5.1.2.4 15W-XX
- 5.1.2.5 Monogrades
- 5.1.2.6 Other Grades
- 5.1.3 Motorcycle Engine Oil (MCO)
- 5.1.3.1 0W-XX
- 5.1.3.2 5W-XX
- 5.1.3.3 10W-XX
- 5.1.3.4 15W-XX
- 5.1.3.5 Monogrades
- 5.1.3.6 Other Grades
- 5.1.1 Passenger Car Motor Oil (PCMO)
- 5.2 By Base Stock
- 5.2.1 Mineral
- 5.2.2 Synthetic
- 5.2.3 Semi-Synthetic
- 5.2.4 Bio-Based
6 Competitive Landscape
- 6.1 Market Concentration
- 6.2 Strategic Moves
- 6.3 Market Share(%)/Ranking Analysis
- 6.4 Company Profiles (includes Global level Overview, Market level overview, Core Segments, Financials as available, Strategic Information, Products and Services, Recent Developments)
- 6.4.1 AMSOIL INC.
- 6.4.2 Blauparts LLC
- 6.4.3 BP p.l.c.
- 6.4.4 Chevron Corporation
- 6.4.5 CITGO Petroleum
- 6.4.6 ExxonMobil Corporation
- 6.4.7 FUCHS
- 6.4.8 Gulf Oil International Ltd
- 6.4.9 Idemitsu Kosan Co., Ltd.
- 6.4.10 Liqui Moly GmbH
- 6.4.11 Lucas Oil Products, Inc.
- 6.4.12 Motul
- 6.4.13 Petro-Canada Lubricants Inc.,
- 6.4.14 Phillips 66 Lubricants
- 6.4.15 Quaker Houghton.
- 6.4.16 Shell plc
- 6.4.17 TotalEnergies
- 6.4.18 Saudi Arabian Oil Co.
7 Market Opportunities and Future Outlook
- 7.1 White-space and Unmet-Need Assessment
8 Key Strategic Questions for CEOs

