
PUBLISHER: Mordor Intelligence | PRODUCT CODE: 2043924

PUBLISHER: Mordor Intelligence | PRODUCT CODE: 2043924
Cloud Kitchen - Market Share Analysis, Industry Trends & Statistics, Growth Forecasts (2026 - 2031)
The Cloud Kitchen Market size is expected to grow from USD 38.30 billion in 2025 to USD 44.78 billion in 2026 and is forecast to reach USD 90.51 billion by 2031 at 15.11% CAGR over 2026-2031.
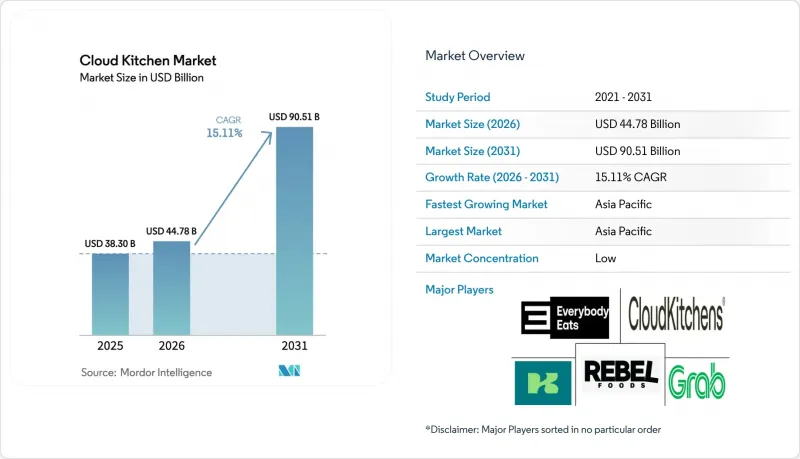
The increasing preference for app-based ordering, rapid urbanization, and sustained venture funding are driving this growth. Mature regions are transitioning from network expansion to focusing on unit-level profitability, maintaining growth momentum. The competitive landscape is shifting as vertically integrated operators consolidate, emphasizing the importance of owning the ordering interface rather than relying on third-party aggregators. Automation, previously in the pilot phase, is now being implemented on a larger scale. High-throughput assembly robots and AI-powered demand forecasting are reducing labor costs and minimizing inventory waste. Additionally, Tier-2 cities in the Asia-Pacific and Latin America regions offer significant growth opportunities. Rising smartphone penetration in these areas enables direct-to-consumer ordering, bypassing the fixed costs associated with dine-in formats and expanding the total addressable market for cloud kitchens. In Europe and certain U.S. regions, sustainability regulations are driving the adoption of recyclable or compostable packaging. While this adds cost pressures, it also creates opportunities for operators to position themselves as premium brands by meeting strict environmental standards.
Global Cloud Kitchen Market Trends and Insights
Widespread adoption of food delivery apps and online platforms
In 2025, 74% of the global population was using the internet, an increase from 71% in 2024. This equates to 6 billion users, up from 5.8 billion the previous year, according to the International Telecommunication Union. Platform networks create a competitive advantage for dominant players: those with high order density on a single platform gain favorable algorithm placements. This reduces customer acquisition costs per order and enhances price competitiveness, which smaller kitchens find difficult to match. In 2024, Deliveroo expanded its operations by adding approximately 3,000 merchant sites and reducing sales-weighted markups by 20% in the UK and Ireland through its Value Programme. This initiative compressed margins for independent operators who lack the scale to negotiate similar commission reductions. The practice of stacked orders, where a single driver picks up multiple orders from nearby kitchens, improves delivery efficiency but concentrates volume in high-density kitchen clusters, disadvantaging isolated operators. The trend toward hyperlocal optimization has made platform success dependent on neighborhood-level kitchen density rather than citywide coverage, benefiting operators located in aggregator-preferred zones. Additionally, the growing use of mobile phones supports the food delivery market. Mobile devices provide significant convenience for food ordering. For example, in 2025, 82% of individuals aged 10 and older globally own a mobile phone, as reported by the International Telecommunication Union.
Lower operational costs compared to traditional restaurants
Ghost kitchens reduce real estate costs by 40% to 60% by operating in industrial or secondary locations. Labor costs, which account for 25% to 35% of revenue in traditional restaurants, drop to 20% to 25% in delivery-only models. Profit margins for ghost kitchens range from 8% to 15%, significantly higher than the 3% to 9% margins of conventional restaurants, even after including platform commissions. European operators report cutting overhead costs by 30% to 50% by eliminating front-of-house staff, decor, and customer-facing real estate expenses. Kitopi, with over 200 locations in five GCC markets, achieved profitability by centralizing procurement and standardizing kitchen layouts, highlighting how scale delivers cost efficiencies unavailable to single-unit operators. This cost advantage is most evident in high-rent urban areas such as New York, London, and Mumbai, where prime retail spaces are significantly more expensive than industrial warehouse rents. This creates a structural benefit for cloud kitchens that traditional restaurants cannot achieve without sacrificing foot traffic.
Food quality and consistency challenges
Environmental health officers in the UK, supported by a study from the National Institute for Health Research, identified the "invisibility" of dark kitchens, frequently operating under multiple trading names, from unregistered premises, and with irregular hours, as the primary obstacle to effective inspections. Operators noted a significant issue: delivery platforms may take up to two days to update allergen or ingredient information. This delay creates a risk, enabling customers with allergies to unknowingly order unsafe items. High staff turnover and understaffing further intensify these risks. Temporary workers, often lacking adequate food safety training, may fail to adhere to essential HACCP protocols, compromising temperature control, cross-contamination prevention, and allergen segregation. Research from CloudKitchens indicates that nearly 70% of diners prefer ordering from restaurants with physical locations. This finding highlights a trust gap that ghost kitchens must address by focusing on professional branding, transparent sourcing, and proactive review management.
Other drivers and restraints analyzed in the detailed report include:
- Technology-enabled ordering and mobile penetration
- Urbanization and changing lifestyles
- Aggregator commission squeeze on operator margins
For complete list of drivers and restraints, kindly check the Table Of Contents.
Segment Analysis
In 2025, independent operators commanded a significant 74.88% of the revenue, underscoring the allure of the cloud kitchen market for entrepreneurs, thanks to its low capital entry barriers and flexible menu options. This trend persists in suburbs and Tier-2 cities, where the ability to swiftly adapt to local tastes offers independents an edge over larger players. Yet, as food safety audits tighten and packaging compliance costs rise, these independents face squeezed margins, resulting in higher closure rates compared to their chained counterparts. Moreover, with digital branding being paramount, independents find themselves pouring more into paid search efforts just to maintain visibility against chains favored by algorithms, subsequently inflating their customer acquisition costs relative to sales.
Chained cloud kitchens are set to outpace the market, expanding at a robust 17.58% CAGR from 2026 to 2031, thanks to their corporate purchasing power and ability to maintain standardized processes. For instance, Rebel Foods, with its expansive network of 450 kitchens, utilizes centralized prep hubs to batch-produce sauces and gravies. This strategy not only minimizes ingredient variance but also enhances consistency across its offerings. Furthermore, the brand's recognition eases the journey for first-time users, boosting both conversion rates and customer lifetime value. In a strategic move, chains have begun negotiating flat-rate contracts with aggregators, securing deals below the 20% mark. This shift narrows the cost disparity between aggregator and direct channels. As a result, with the compounding effect of operating leverage, the market share of cloud kitchens attributed to these chains is on track to more than double by 2031.
The Cloud Kitchen Market Report is Segmented by Nature of Operation (Independent Cloud Kitchen, Chained Cloud Kitchen), Cuisine Type (Asian Cuisine, European Cuisine, and More), Ordering Model (Third-Party Aggregator Platforms, and More), and Geography (North America, Europe, Asia-Pacific, South America, Middle East and Africa). The Market Forecasts are Provided in Terms of Value (USD).
Geography Analysis
In 2025, the Asia-Pacific region led the cloud kitchen market, accounting for a 41.22% revenue share. The region is expected to grow at a robust 18.24% CAGR through 2031. India, Indonesia, and China are at the forefront, with smartphone adoption exceeding 80% among urban adults and digital wallets enabling seamless payments. Companies such as Rebel Foods and Swiggy are driving growth by combining large-scale dark stores with rapid grocery fulfillment. This approach diversifies revenue streams while maximizing the utilization of fixed assets. Additionally, Saudi Arabia's Vision 2030 and NEOM city's urban planning initiatives are supporting the regional cloud kitchen market by allocating specific zones for delivery-only facilities.
North America, a mature market, is defined by aggregator dominance and stricter labor regulations. The Wonder Group is expanding vertically integrated hubs along the east coast, strategically located near densely populated residential areas to ensure faster deliveries and maintain food quality. Similarly, Kitchen United's store-within-store model in Kroger supermarkets highlights a shift in retailers' roles from tenants to collaborative partners. This strategy not only creates new revenue opportunities but also builds consumer trust through physical presence. In California, sustainability regulations have increased compliance costs but have also driven innovation in compostable packaging, setting trends that are being adopted in Europe.
South America, the Middle East, and Africa are in earlier stages of development but show significant growth potential. In 2024, Brazil's off-premise dining market reached BRL 61.4 billion, with Mexico following a similar growth pattern due to fintech advancements facilitating the transition from cash to digital payments. GCC markets benefit from strong purchasing power and a cosmopolitan workforce, while Sub-Saharan Africa faces challenges due to fragmented cold-chain infrastructure. However, strategic franchising and mobile-first ordering solutions are helping bridge these gaps, positioning emerging economies as critical demand centers in the next phase of the global cloud kitchen market.
- CloudKitchens
- Rebel Foods
- Kitopi Catering Services LLC
- Kitchen United
- Deliveroo plc (Editions)
- Grab Holdings Ltd (GrabKitchen)
- Delivery Hero SE
- EatClub Brands Pvt Ltd
- Wonder Group Inc.
- REEF Technology Inc.
- DoorDash Kitchens
- Zomato Kitchens
- Swiggy Access
- Foodology SAS
- PT Modular Kuliner Indonesia (Hangry)
- CloudEats
- Taster
- Ghost Kitchen Brands
- ClusterTruck Inc.
- Virtual Dining Concepts
Additional Benefits:
- The market estimate (ME) sheet in Excel format
- 3 months of analyst support
TABLE OF CONTENTS
1 INTRODUCTION
- 1.1 Study Assumptions and Market Definition
- 1.2 Scope of the Study
2 RESEARCH METHODOLOGY
3 EXECUTIVE SUMMARY
4 MARKET LANDSCAPE
- 4.1 Market Overview
- 4.2 Market Drivers
- 4.2.1 Widespread adoption of food delivery apps and online platforms
- 4.2.2 Lower operational costs compared to traditional restaurants
- 4.2.3 Technology?enabled ordering and mobile penetration
- 4.2.4 Urbanization and changing lifestyles
- 4.2.5 Emergence of virtual brands and multi-concept kitchens
- 4.2.6 Dark-kitchen co-location within retail fulfilment centres
- 4.3 Market Restraints
- 4.3.1 Food quality and consistency challenges
- 4.3.2 Aggregator commission squeeze on operator margins
- 4.3.3 Complex logistics and last-mile delivery issues
- 4.3.4 Packaging and sustainability concerns
- 4.4 Consumer Behavior Analysis
- 4.5 Regulatory Landscape
- 4.6 Technological Outlook
- 4.7 Porter's Five Forces
- 4.7.1 Threat of New Entrants
- 4.7.2 Bargaining Power of Buyers
- 4.7.3 Bargaining Power of Suppliers
- 4.7.4 Threat of Substitutes
- 4.7.5 Intensity of Competitive Rivalry
5 MARKET SIZE AND GROWTH FORECASTS (VALUE)
- 5.1 By Nature of Operation
- 5.1.1 Independent Cloud Kitchen
- 5.1.2 Chained Cloud Kitchen
- 5.2 By Cuisine Type
- 5.2.1 Asian Cuisine
- 5.2.2 European Cuisine
- 5.2.3 Middle Eastern cuisine
- 5.2.4 Mexican Cuisine
- 5.2.5 North American Cuisine
- 5.2.6 Other Cuisine Types
- 5.3 By Ordering Model
- 5.3.1 Third-Party Aggregator Platforms
- 5.3.2 Direct-to-Consumer Websites/Apps
- 5.3.3 Subscription Meal Plans
- 5.4 By Geography
- 5.4.1 North America
- 5.4.1.1 United States
- 5.4.1.2 Canada
- 5.4.1.3 Mexico
- 5.4.1.4 Rest of North America
- 5.4.2 Europe
- 5.4.2.1 United Kingdom
- 5.4.2.2 Germany
- 5.4.2.3 France
- 5.4.2.4 Italy
- 5.4.2.5 Spain
- 5.4.2.6 Russia
- 5.4.2.7 Sweden
- 5.4.2.8 Belgium
- 5.4.2.9 Poland
- 5.4.2.10 Netherlands
- 5.4.2.11 Rest of Europe
- 5.4.3 Asia-Pacific
- 5.4.3.1 China
- 5.4.3.2 Japan
- 5.4.3.3 India
- 5.4.3.4 Thailand
- 5.4.3.5 Singapore
- 5.4.3.6 Indonesia
- 5.4.3.7 South Korea
- 5.4.3.8 Australia
- 5.4.3.9 New Zealand
- 5.4.3.10 Rest of Asia-Pacific
- 5.4.4 South America
- 5.4.4.1 Brazil
- 5.4.4.2 Argentina
- 5.4.4.3 Colombia
- 5.4.4.4 Chile
- 5.4.4.5 Rest of South America
- 5.4.5 Middle East and Africa
- 5.4.5.1 United Arab Emirates
- 5.4.5.2 South Africa
- 5.4.5.3 Saudi Arabia
- 5.4.5.4 Nigeria
- 5.4.5.5 Egypt
- 5.4.5.6 Morocco
- 5.4.5.7 Turkey
- 5.4.5.8 Rest of Middle East and Africa
- 5.4.1 North America
6 COMPETITIVE LANDSCAPE
- 6.1 Market Concentration
- 6.2 Strategic Moves
- 6.3 Market Share Analysis
- 6.4 Company Profiles (includes Global level Overview, Market level overview, Core Segments, Financials as available, Strategic Information, Market Rank/Share for key companies, Products and Services, and Recent Developments)
- 6.4.1 CloudKitchens
- 6.4.2 Rebel Foods
- 6.4.3 Kitopi Catering Services LLC
- 6.4.4 Kitchen United
- 6.4.5 Deliveroo plc (Editions)
- 6.4.6 Grab Holdings Ltd (GrabKitchen)
- 6.4.7 Delivery Hero SE
- 6.4.8 EatClub Brands Pvt Ltd
- 6.4.9 Wonder Group Inc.
- 6.4.10 REEF Technology Inc.
- 6.4.11 DoorDash Kitchens
- 6.4.12 Zomato Kitchens
- 6.4.13 Swiggy Access
- 6.4.14 Foodology SAS
- 6.4.15 PT Modular Kuliner Indonesia (Hangry)
- 6.4.16 CloudEats
- 6.4.17 Taster
- 6.4.18 Ghost Kitchen Brands
- 6.4.19 ClusterTruck Inc.
- 6.4.20 Virtual Dining Concepts
7 MARKET OPPORTUNITIES AND FUTURE OUTLOOK

