
PUBLISHER: Mordor Intelligence | PRODUCT CODE: 2043954

PUBLISHER: Mordor Intelligence | PRODUCT CODE: 2043954
Calcium Ammonium Nitrate - Market Share Analysis, Industry Trends & Statistics, Growth Forecasts (2025 - 2030)
The calcium ammonium nitrate market size is currently valued at USD 5.5 billion and is projected to reach USD 6.9 billion by 2030, reflecting a 4.6% CAGR.
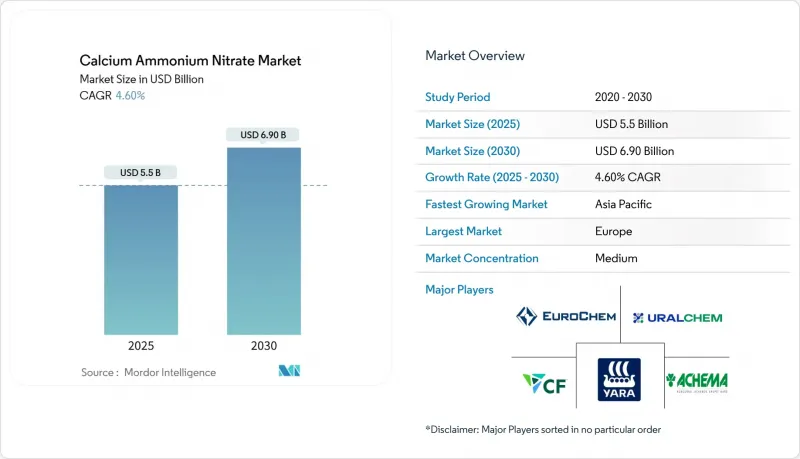
Market size growth stems from European decarbonization mandates, Asia-Pacific greenhouse expansion, and precision-driven fertilizer use that tilts demand toward lower-carbon nitrate products . Heightened natural gas prices in Europe are pushing producers to invest in low-carbon ammonia pathways, while the forthcoming Carbon Border Adjustment Mechanism will add cost pressure to high-carbon imports, increasing domestic competitiveness . The Asia-Pacific region leads regional growth, driven by the rapid adoption of fertigation. Meanwhile, Europe remains the largest regional market, supported by stringent nitrate regulations that favor chloride-free fertilizers. Liquid formulations are experiencing strong growth as growers adopt fertigation and precision delivery systems. At the same time, regenerative farming trends and transportation safety rules temper overall volume growth by encouraging efficient application rates and increasing logistics costs.
Global Calcium Ammonium Nitrate Market Trends and Insights
Evolving European Nitrate-Use Regulations Favoring Low-Carbon Fertilizers
The 2022 entry into force of Regulation (EU) 2019/1009 tightened composition and footprint rules, creating a premium tier for compliant calcium ammonium nitrate while limiting market access for higher-carbon alternatives . Producers are investing in carbon capture to meet the European Union's goal of storing 50 million metric tons of CO2 annually by 2030, positioning compliant fertilizers for export advantage as other regions align with European Union (EU) standards.
Shift Toward Chloride-Free Nitrogen Sources for High-Value Horticulture
Premium fruit and vegetable growers favor calcium ammonium nitrate because its chloride-free profile prevents salinity stress in sensitive crops. Controlled-environment agriculture in China, which comprises 60% of global greenhouse area, relies on nitrate-based inputs that preserve soil health and boost yield. Field studies show improved fruit set and reduced drop in pomegranate when calcium nitrate supplements standard nitrogen regimes.
Volatility in Natural-Gas-Derived Ammonia Feedstock Prices
Natural gas price volatility continues to create significant margin pressure for calcium ammonium nitrate producers, with European manufacturers particularly exposed to supply disruptions and price spikes. The United States Energy Information Administration reports that ammonia prices increased sixfold over a two-year period, primarily driven by international natural gas price fluctuations that directly impact production economics. This volatility is compounded by geopolitical tensions affecting gas supplies, with European producers facing sustained high energy costs that undermine their competitive position relative to regions with abundant, low-cost natural gas. The interconnected nature of global ammonia markets means that regional price shocks rapidly transmit across supply chains, creating unpredictable cost structures for downstream calcium ammonium nitrate production. Producers are responding by investing in carbon capture technologies and integrating renewable energy to reduce their dependence on volatile fossil fuel inputs, although these solutions require substantial capital investment and longer implementation timelines.
Other drivers and restraints analyzed in the detailed report include:
- Growing Fertigation Adoption in Water-Scarce Regions
- Government Incentives for Controlled-Release Formulations
- Tightening Nitrate Transport Regulations
For complete list of drivers and restraints, kindly check the Table Of Contents.
Segment Analysis
Granular fertilizers retained 60% of 2024 revenue owing to established soil broadcasting practices across broad-acre crops. OCI reported average calcium ammonium nitrate pricing of USD 294 per metric ton as of 2024, as demand remained steady. The liquid segment now grows at a 6.6% CAGR, propelled by fertigation use among greenhouse growers seeking rapid delivery and uniform nutrient distribution. Producers highlight the compatibility of liquids with automated injection pumps, which reduce labor and improve dosing accuracy. The calcium ammonium nitrate market size for liquid solutions is projected to expand rapidly through 2030 as precision agriculture gains traction on mid-scale farms. Granular products continue serving regions lacking micro-irrigation, supporting balanced growth across both forms.
Liquid adoption marks a broader industry shift toward data-driven farming. Modern sensing tools map real-time nutrient demand, allowing timed liquid injections that prevent leaching. This integration can cut per-hectare application volumes while sustaining yield, aligning with tightening nitrate discharge regulations. Granular materials remain vital in areas that favor bulk handling and season-long release, ensuring the calcium ammonium nitrate market continues to diversify across various delivery technologies.
The Calcium Ammonium Nitrate Market is Segmented by Physical Form (Granular (Dry) CAN and Liquid (Solution) CAN), by Crop Type (Cereals and Grains, and More), by Mode of Application (Soil Application, Fertigation, and Foliar), and by Geography (North America, Europe, Asia-Pacific, South America, Africa, and Middle East). The Market Forecasts are Provided in Terms of Value (USD).
Geography Analysis
Europe maintained a dominant 39% share in 2024, propelled by stringent nitrate and carbon policies that elevate compliant calcium ammonium nitrate demand. Regional growth runs at a moderate 2.7% CAGR to 2030 as market maturity balances regulatory pull. Germany and France, characterized by intensive farming and environmental compliance, are the largest national buyers. Producers prioritize carbon capture and renewable power at ammonia plants to preserve market access under the Carbon Border Adjustment Mechanism, set for full enforcement by 2026.
Asia-Pacific is the fastest-growing region at a 5.7% CAGR, driven by greenhouse expansion in China and India's subsidy regime that supports nitrate blends. Rapid fertigation adoption in water-stressed northern China and western India amplifies demand for fully soluble nitrate fertilizers. Government schemes encouraging precision agriculture and controlled-environment farming shift focus toward high-purity inputs, anchoring long-term volume gains.
North America exhibits steady growth. Corn and soybean rotations maintain baseline consumption, while sustainability incentives under the Inflation Reduction Act push producers toward low-carbon ammonia projects. Canada's emphasis on 4R nutrient stewardship and the United States' transport safety updates shape demand toward controlled-release and carbon-verified nitrates. South America, the Middle East, and Africa together account for a rising share as Brazil scales crop area and Gulf nations pursue food security through greenhouse megaprojects.
- Yara International ASA
- EuroChem Group AG
- CF Industries Holdings Inc.
- Achema AB
- Uralchem JSC
- OCI
- Fertiberia S.A.
- Koch Fertilizer LLC (Koch Ag & Energy Solutions, LLC.)
- Grupa Azoty S.A.
- Acron Group
- Haifa Chemicals Ltd.
- Yunnan Yuntianhua Co. Ltd.
- Fatima Group
- YILDIRIM Group
- J.R. Simplot Company
Additional Benefits:
- The market estimate (ME) sheet in Excel format
- 3 months of analyst support
TABLE OF CONTENTS
1 Introduction
- 1.1 Study Assumptions and Market Definition
- 1.2 Scope of the Study
2 Research Methodology
3 Executive Summary
4 Market Landscape
- 4.1 Market Overview
- 4.2 Market Drivers
- 4.2.1 Evolving European nitrate-use regulations favoring low-carbon fertilizers
- 4.2.2 Shift toward chloride-free nitrogen sources for high-value horticulture
- 4.2.3 Growing fertigation adoption in water-scarce regions
- 4.2.4 Government incentives for controlled-release formulations
- 4.2.5 Rapid greenhouse expansion in Asia-Pacific
- 4.2.6 Emergence of carbon-credit monetization for low-N2O fertilizers
- 4.3 Market Restraints
- 4.3.1 Volatility in natural-gas-derived ammonia feedstock prices
- 4.3.2 Tightening nitrate transport regulations
- 4.3.3 Competition from urea and Urea Ammonium Nitrate (UAN) solutions in broad-acre crops
- 4.3.4 Rising adoption of regenerative agriculture limiting synthetic inputs
- 4.4 Regulatory Landscape
- 4.5 Technological Outlook
- 4.6 Porter's Five Forces Analysis
- 4.6.1 Threat of New Entrants
- 4.6.2 Bargaining Power of Suppliers
- 4.6.3 Bargaining Power of Buyers
- 4.6.4 Threat of Substitutes
- 4.6.5 Intensity of Competitive Rivalry
5 Market Size and Growth Forecasts (Value)
- 5.1 By Physical Form
- 5.1.1 Granular (Dry) CAN
- 5.1.2 Liquid (Solution) CAN
- 5.2 By Crop Type
- 5.2.1 Cereals and Grains
- 5.2.2 Oilseeds and Pulses
- 5.2.3 Fruits and Vegetables
- 5.2.4 Turf and Ornamentals
- 5.3 By Mode of Application
- 5.3.1 Soil Application
- 5.3.2 Fertigation
- 5.3.3 Foliar
- 5.4 By Geography
- 5.4.1 North America
- 5.4.1.1 United States
- 5.4.1.2 Canada
- 5.4.1.3 Mexico
- 5.4.1.4 Rest of North America
- 5.4.2 South America
- 5.4.2.1 Brazil
- 5.4.2.2 Argentina
- 5.4.2.3 Rest of South America
- 5.4.3 Europe
- 5.4.3.1 Germany
- 5.4.3.2 France
- 5.4.3.3 Russia
- 5.4.3.4 Rest of Europe
- 5.4.4 Asia-Pacific
- 5.4.4.1 China
- 5.4.4.2 India
- 5.4.4.3 Japan
- 5.4.4.4 Rest of Asia-Pacific
- 5.4.5 Middle East
- 5.4.5.1 Saudi Arabia
- 5.4.5.2 Turkey
- 5.4.5.3 Rest of Middle East
- 5.4.6 Africa
- 5.4.6.1 South Africa
- 5.4.6.2 Egypt
- 5.4.6.3 Rest of Africa
- 5.4.1 North America
6 Competitive Landscape
- 6.1 Market Concentration
- 6.2 Strategic Moves
- 6.3 Market Share Analysis
- 6.4 Company Profiles (Includes Global Level Overview, Market Level Overview, Core Segments, Financials as Available, Strategic Information, Market Rank/Share for Key Companies, Products and Services, and Recent Developments)
- 6.4.1 Yara International ASA
- 6.4.2 EuroChem Group AG
- 6.4.3 CF Industries Holdings Inc.
- 6.4.4 Achema AB
- 6.4.5 Uralchem JSC
- 6.4.6 OCI
- 6.4.7 Fertiberia S.A.
- 6.4.8 Koch Fertilizer LLC (Koch Ag & Energy Solutions, LLC.)
- 6.4.9 Grupa Azoty S.A.
- 6.4.10 Acron Group
- 6.4.11 Haifa Chemicals Ltd.
- 6.4.12 Yunnan Yuntianhua Co. Ltd.
- 6.4.13 Fatima Group
- 6.4.14 YILDIRIM Group
- 6.4.15 J.R. Simplot Company
7 Market Opportunities and Future Outlook

