
PUBLISHER: Mordor Intelligence | PRODUCT CODE: 2043957

PUBLISHER: Mordor Intelligence | PRODUCT CODE: 2043957
Middle East Data Center SSD - Market Share Analysis, Industry Trends & Statistics, Growth Forecasts (2026 - 2031)
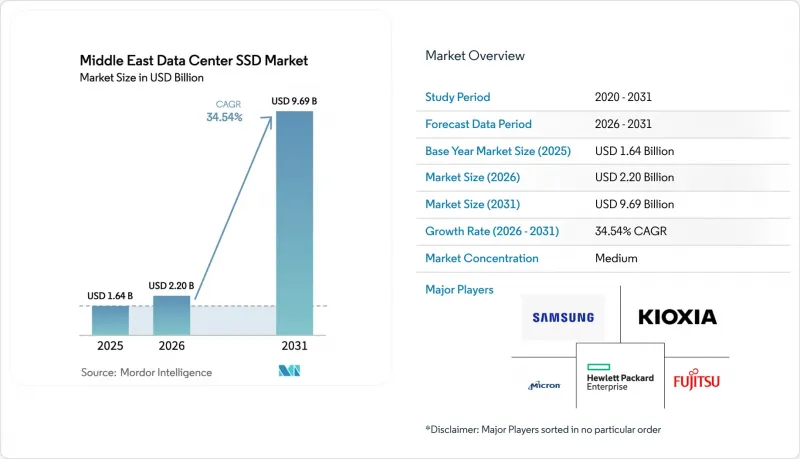
The Middle East data center SSD market size is projected to expand from USD 1.64 billion in 2025 and USD 2.20 billion in 2026 to USD 9.69 billion by 2031, registering a CAGR of 34.54% between 2026 to 2031.
Fierce investment by Gulf Cooperation Council governments is transferring sovereign oil revenue into hyperscale campuses that demand low-latency, all-flash storage for artificial intelligence, edge analytics, and high-performance computing. Sovereign data-protection rules in Saudi Arabia, the United Arab Emirates, and Qatar force in-country retention of personal information, encouraging greenfield builds instead of retrofits. Operators are standardizing on non-volatile memory express interfaces and advanced form factors to maximize rack density in a region where land and power are expensive and ambient temperatures are high. Intensifying NAND layer counts are pushing cost per gigabyte toward parity with mission-critical hard disk drives, giving the Middle East data center SSD market a cost tailwind alongside the policy and workload catalysts.
Middle East Data Center SSD Market Trends and Insights
Accelerating AI and HPC Workloads In GCC Hyperscale Data Centers Driving NVMe Adoption
Government-backed capital is flowing into hyperscale campuses that train large language models and run high-fidelity simulations, workloads that are intolerant of disk latency. Microsoft and G42 committed USD 15.2 billion to add 200 MW of capacity in the United Arab Emirates, and the United States-UAE initiative targets a 5 GW artificial-intelligence estate, both architected around non-volatile memory express drives delivering sub-100-microsecond read latency. Oracle entered the region in 2025 with a GPU-rich cluster that streams data at 14 GB/s through PCIe Gen5 controllers, showing operators the practical advantage of an all-flash spine. Saudi Arabia's Public Investment Fund allocated more than USD 21 billion to projects such as the 480 MW Hexagon facility, positioning NVMe arrays as the default storage layer for sovereign AI models. As compute density climbs, campuses prefer SSDs that minimize I/O bottlenecks and simplify horizontal scaling, giving the Middle East data center SSD market strong structural momentum.
Saudi Vision 2030 and UAE Digital-Government Projects Funding Greenfield All-Flash Sites
Riyadh's National Data Center Strategy targets 1.5 GW by 2030 and requires public workloads to run in domestic facilities certified to stringent security standards, a decree that effectively locks in flash media from the first rack. Abu Dhabi spent AED 13 billion (USD 3.5 billion) on a 19 MW government data centre that cut power draw by 40% after migrating to NVMe arrays. The UAE Central Bank is building a sovereign financial cloud with Core42, adding another workload that cannot leave national borders and therefore must sit on local, high-performance drives. DataVolt and Neom agreed to a USD 5 billion hyperscale campus that scales to 1 GW and uses ruler-style E1.S drives for density, proving that fresh land and power allocations allow flash to displace spinning media from day one.
NAND Price-Volatility Cycles Compressing Vendor Margins
Memory-chip prices doubling across 2025-2026 as suppliers diverted wafers to automotive and mobile lines, lifting enterprise-SSD contract prices by more than 50%. Samsung raised quotes quarter over quarter, while Transcend publicly acknowledged a lapse in NAND deliveries that forced a production halt. Controller specialists such as Phison recorded fill rates below 30%, stretching lead times to 30 weeks and exposing Middle East operators that buy on the spot market to severe cost swings. Prolonged volatility pressures already thin margins for regional system integrators and may slow purchase orders even as workloads climb.
Other drivers and restraints analyzed in the detailed report include:
- Declining USD/GB ff 3D NAND Reaching Price Parity with Mission-Critical HDDs
- Edge and 5G Micro-Data-Center Rollouts In Oil and Gas Fields Demanding Rugged, Low-Power SSDs
- Persistent Controller-IC Supply Constraints Extending Enterprise SSD Lead Times
For complete list of drivers and restraints, kindly check the Table Of Contents.
Segment Analysis
The 2.5-inch U.2 and U.3 bays delivered 58.13% of the Middle East data center SSD market share in 2025, reflecting their compatibility with legacy hot-swap trays. EDSFF variants is expected to expand at a 35.14% CAGR during the forecast period. Rising rack-space premiums and airflow constraints, however, are prompting operators to pursue the elongated data center SSD capacities enabled by E1.S, E1.L, and E3 designs that double drive count per rack unit. Leading hyperscalers in the region have moved pilot clusters to E1.S sleds that cut power draw per terabyte by more than one-third. Thermal gains are equally important, because denser flash arrays let facilities throttle fan speeds and sustain economizer cooling in desert climates. These savings resonate with utility tariffs that now index costs to load factor, making slimmer drives a hedge against future electricity reforms.
The transition accelerates in 2026 as controller roadmaps converge on EDSFF first, leaving legacy 2.5-inch form factors a step behind the performance curve. Western Digital's Ultrastar DC SN861 in E1.S sustains 13.5 GB/s writes while operating at 45 °C air, a specification aligned with Gulf climatics. Kioxia's CD8-V in E3.S adds 30.72 TB in a single stick, letting Saudi Arabia's Hexagon campus fit 1.5 PB per 42U cabinet without exotic cooling. As a result, the Middle East data center SSD market size for EDSFF units is positioned for outsized growth, while U.2 demand tapers toward refresh rather than expansion cycles. Vendors that lack an EDSFF line risk displacement as procurement documents embed the new form factor as a minimum requirement.
PCIe captured 70.21% of the market share in 2025 and will continue compounding at a 35.74% CAGR as Gen5 boards reach 14 GB/s, saturating GPU pipelines in AI clusters. SATA maintains a niche in cost-sensitive edge gateways, yet its 6 Gb/s ceiling cannot service real-time inference. SAS fell to a mid-single-digit slice as dual-port redundancy now arrives via network fabrics rather than controller pairs. The Middle East data center SSD market size tied to PCIe therefore rises not only on unit growth but also on average selling price, because higher lane counts and faster controllers carry better margins.
Gen6 silicon finalised at 128 GT/s in the PCI-SIG 6.0 spec ships to hyperscalers in late 2026, doubling Gen5 throughput and ensuring ample headroom for next-generation GPUs. UAE projects backed by Microsoft-G42 have written Gen5 as baseline and request Gen6 readiness, illustrating how buyers in the region leapfrog incremental steps. Backward compatibility lets operators stage upgrades without forklift swaps, smoothing deployment Cadence. This dynamic keeps the Middle East data center SSD market firmly oriented around PCIe, while SATA fades into archival edges.
TLC led the market at 36.72% in 2025 thanks to its balance of price and write endurance, though QLC is set to climb at a 35.46% CAGR during the forecast period by offering 50% higher areal density. Rising layer counts above 280 let QLC drives promise 1 drive write per day over 5 years, adequate for object storage and analytics lakes that dominate hyperscale clouds. The shrinking cost delta invites operators to replace cold HDD tiers with flash, a shift that benefits the Middle East data center SSD market, where floor space and cooling caps are binding.
Micron's 232-layer QLC and Solidigm's 61.44 TB ruler both demonstrate that four-bit cells can deliver 7 GB/s sequential writes while holding down watts per terabyte. Western Digital's dynamic write acceleration further stretches durability by staging writes in SLC buffers, removing the last argument against deep QLC adoption. Together, these moves will rebalance the Middle East data center SSD market share between TLC and QLC by the decade's close.
The Middle East Data Center SSD Market Report is Segmented by Form Factor (2. 5-Inch, M. 2, and More), Interface (SATA, SAS, and PCIe), NAND Technology (SLC, MLC, TLC, and QLC), Capacity Range (<=1 TB, and More), Tier Type (Tier 1 and 2, Tier 3, and Tier 4), Data Center Size (Small, Medium, Large, and Hyperscale), Data Center Type (Colocation, and More), and Country. The Market Forecasts are Provided in Terms of Value (USD).
List of Companies Covered in this Report:
- Samsung Electronics Co., Ltd.
- Kioxia Corporation
- Western Digital Corporation
- Solidigm (SK hynix Inc.)
- Micron Technology, Inc.
- Seagate Technology Holdings plc
- Kingston Technology Corp.
- Phison Electronics Corp.
- Silicon Motion Technology Corp.
- Marvell Technology, Inc.
- Huawei Technologies Co., Ltd. (FusionSSD)
- Inspur Electronic Information Industry Co., Ltd.
- Lenovo Group Limited (ThinkSystem SSD)
- Hewlett Packard Enterprise Co.
- Lightbits Labs Ltd.
- GRAID Technology Inc.
- Nimbus Data, Inc.
- Pure Storage, Inc.
- Fujitsu Limited
- Dell Technologies Inc. (Dell EMC Enterprise SSDs)
Additional Benefits:
- The market estimate (ME) sheet in Excel format
- 3 months of analyst support
TABLE OF CONTENTS
1 INTRODUCTION
- 1.1 Study Assumptions and Market Definition
- 1.2 Scope of the Study
2 RESEARCH METHODOLOGY
3 EXECUTIVE SUMMARY
4 MARKET LANDSCAPE
- 4.1 Market Overview
- 4.2 Market Drivers
- 4.2.1 Accelerating AI and HPC Workloads in GCC Hyperscale Data Centers Driving NVMe Adoption
- 4.2.2 Saudi Vision 2030 and UAE Digital-Government Projects Funding Greenfield All-Flash Sites
- 4.2.3 Declining USD/GB of 3D-NAND Reaching Price-Parity With Mission-Critical HDDs
- 4.2.4 Edge and 5G Micro-Data-Center Roll-Outs in Oil and Gas Fields Demanding Rugged, Low-Power SSDs
- 4.2.5 Regional Data-Sovereignty Mandates (Saudi PDPL, UAE DIFC, Qatar PDP) Spurring In-Country All-Flash Builds
- 4.2.6 Early CXL and Computational-Storage Pilots Led by Israel's Semiconductor Ecosystem
- 4.3 Market Restraints
- 4.3.1 NAND Price-Volatility Cycles Compressing Vendor Margins
- 4.3.2 Persistent Controller-IC Supply Constraints Extending Enterprise-SSD Lead-Times
- 4.3.3 Escalating Electricity-Tariff Reforms Raising TCO for Regional Operators
- 4.3.4 Geopolitical Tensions and Cross-Border Trade Restrictions Heightening Supply-Chain Risk
- 4.4 Industry Value Chain Analysis
- 4.5 Regulatory Landscape
- 4.6 Technological Outlook
- 4.7 Impact of Macroeconomic Factors on the Market
- 4.8 Porter's Five Forces Analysis
- 4.8.1 Bargaining Power of Buyers
- 4.8.2 Bargaining Power of Suppliers
- 4.8.3 Threat of New Entrants
- 4.8.4 Threat of Substitutes
- 4.8.5 Intensity of Competitive Rivalry
5 MARKET SIZE AND GROWTH FORECASTS (VALUE)
- 5.1 By Form Factor
- 5.1.1 2.5-inch (U.2/U.3)
- 5.1.2 M.2
- 5.1.3 PCIe Add-In Card
- 5.1.4 EDSFF (E1.S/E1.L/E3)
- 5.2 By Interface
- 5.2.1 SATA
- 5.2.2 SAS
- 5.2.3 PCIe
- 5.2.3.1 PCIe/NVMe Gen3
- 5.2.3.2 PCIe/NVMe Gen4
- 5.2.3.3 PCIe/NVMe Gen5
- 5.2.3.4 PCIe/NVMe Gen6
- 5.3 By NAND Technology
- 5.3.1 SLC
- 5.3.2 MLC
- 5.3.3 TLC
- 5.3.4 QLC
- 5.4 By Capacity Range
- 5.4.1 <=1 TB
- 5.4.2 1-2 TB
- 5.4.3 2-4 TB
- 5.4.4 >=4 TB
- 5.5 By Tier Type
- 5.5.1 Tier 1 and 2
- 5.5.2 Tier 3
- 5.5.3 Tier 4
- 5.6 By Data Center Size
- 5.6.1 Small Data Center
- 5.6.2 Medium Data Center
- 5.6.3 Large Data Center
- 5.6.4 Hyperscale Data Center
- 5.7 By Data Center Type
- 5.7.1 Colocation Data Center
- 5.7.2 Hyperscalers Data Center/CSPs
- 5.7.3 Enterprise and Edge Data Center
- 5.8 By Country
- 5.8.1 Saudi Arabia
- 5.8.2 United Arab Emirates
- 5.8.3 Turkey
- 5.8.4 Rest of Middle East
6 COMPETITIVE LANDSCAPE
- 6.1 Market Share Analysis
- 6.2 Company Profiles (Includes Global Level Overview, Market Level Overview, Core Segments, Financials as Available, Strategic Information, Market Rank/Share, Products and Services, and Recent Developments)
- 6.2.1 Samsung Electronics Co., Ltd.
- 6.2.2 Kioxia Corporation
- 6.2.3 Western Digital Corporation
- 6.2.4 Solidigm (SK hynix Inc.)
- 6.2.5 Micron Technology, Inc.
- 6.2.6 Seagate Technology Holdings plc
- 6.2.7 Kingston Technology Corp.
- 6.2.8 Phison Electronics Corp.
- 6.2.9 Silicon Motion Technology Corp.
- 6.2.10 Marvell Technology, Inc.
- 6.2.11 Huawei Technologies Co., Ltd. (FusionSSD)
- 6.2.12 Inspur Electronic Information Industry Co., Ltd.
- 6.2.13 Lenovo Group Limited (ThinkSystem SSD)
- 6.2.14 Hewlett Packard Enterprise Co.
- 6.2.15 Lightbits Labs Ltd.
- 6.2.16 GRAID Technology Inc.
- 6.2.17 Nimbus Data, Inc.
- 6.2.18 Pure Storage, Inc.
- 6.2.19 Fujitsu Limited
- 6.2.20 Dell Technologies Inc. (Dell EMC Enterprise SSDs)
7 MARKET OPPORTUNITIES AND FUTURE OUTLOOK
- 7.1 White-Space and Unmet-Need Assessment

