PUBLISHER: Mordor Intelligence | PRODUCT CODE: 2043978

PUBLISHER: Mordor Intelligence | PRODUCT CODE: 2043978
Power Supply Units (PSU) - Market Share Analysis, Industry Trends & Statistics, Growth Forecasts (2026 - 2031)
The power supply units (PSU) market size is projected to expand from USD 35.86 billion in 2025 and USD 38.03 billion in 2026 to USD 52.19 billion by 2031, registering a CAGR of 6.54% between 2026 to 2031.
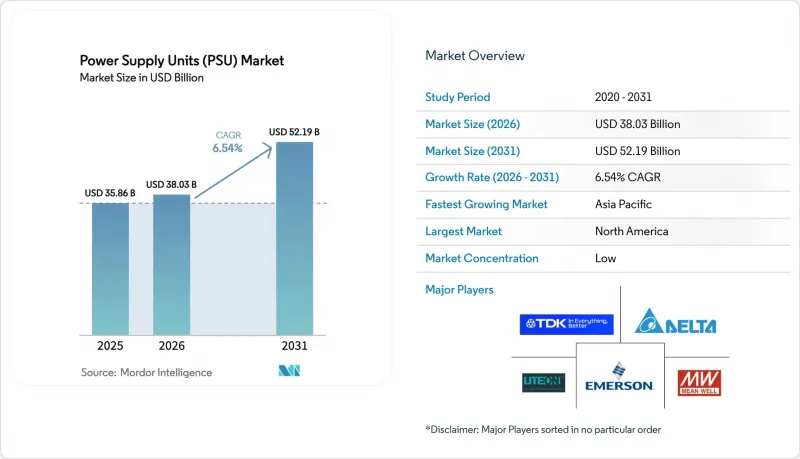
Demand is shifting from high-volume commoditized bricks toward value-added topologies that meet hyperscale data-center density targets and electrification mandates. Tightened no-load efficiency limits under the European Ecodesign Directive and California's Title 20 are accelerating adoption of digital control loops and synchronous rectification. At the same time, Intel's ATX 3.0 specification has upended the gaming segment, forcing vendors to redesign transient-response circuitry for GPUs that exceed 600 W draw. Raw-material volatility in ferrite cores and silicon carbide wafers is widening the cost gap between vertically integrated incumbents and fab-less challengers.
Global Power Supply Units (PSU) Market Trends and Insights
Rapid Expansion of Hyperscale and Edge Data Centers
Hyperscale operators announced more than USD 6 billion of new facilities during 2025, each requiring PSUs that deliver 96% efficiency at 50% load and hot-swap modularity to meet five-minute repair windows. Edge deployments compound demand because 5G base stations need compact units that survive -40 °C to +70 °C ambient ranges. Liquid-cooled racks drive interest in 54 V bus architectures that cut resistive losses, although pilots at Amazon Web Services and Meta remain in validation. Suppliers with digital telemetry and predictive maintenance in their racks report higher design-win rates as operators monetize uptime. Consequently, the power supply units market is tilting toward high-density, data-center-specific platforms that command premium margins.
ATX 3.0 and PCIe 5.1 Upgrade Cycle in Gaming and Workstation PCs
The ATX 3.0 guide introduced the 12VHPWR connector with 200% transient tolerance, reshaping the enthusiast PC ecosystem. NVIDIA's RTX 50-series launch made compliance mandatory, and Corsair noted that ATX 3.0-ready units counted for over 70% of its Q4 2025 shipments. Workstation builders targeting AI rendering embrace dual-rail 12 V outputs that balance multi-GPU loads without breaching UL 62368-1 limits. OEMs willing to absorb redesign costs gain early-mover recognition among gamers and content creators. This refresh cycle bolsters average selling prices, lifting the power supply units market even as unit volumes stay flat.
Raw-Material Price Volatility for Magnetics and Semiconductors
Ferrite core prices surged 22% year-over-year in Q1 2025 because of supply disruptions at Asian producers. Silicon-carbide MOSFET average selling prices remain three to four times higher than silicon, with lead times extending beyond 26 weeks as of January 2026. Copper foil inflation, tied to EV battery demand, forces redesigns of printed-circuit-board trace widths to maintain bill-of-materials ceilings. Larger firms hedge through multi-year supply agreements, but smaller ODMs face margin compression that slows new-product introduction. Such volatility erodes profitability across the power supply units market, especially in mid-tier consumer segments where pass-through pricing is limited.
Other drivers and restraints analyzed in the detailed report include:
- Growing Demand for 80 PLUS-Certified Energy-Efficient PSUs
- Shift Toward 48 V Direct-to-Rack Architectures in Next-Gen Data Centers
- Rising Adoption of Native-DC Facilities Reducing AC-DC PSU Volumes
For complete list of drivers and restraints, kindly check the Table Of Contents.
Segment Analysis
AC-DC products retained 62.35% of the power supply units (PSU) market in 2025 as their galvanic isolation meets safety codes in telecom, industrial, and consumer gear. The power supply units market size for these bricks remains stable because every grid-connected device still needs a primary conversion stage. DC-DC converters populate battery-powered systems where 95% efficiency and sub-15 mm heights are mandatory; their niche role provides margin insulation for specialist vendors. DC-AC inverters are on a 7.83% CAGR trajectory, fueled by rooftop solar feed-in tariffs and UPS deployments in emerging economies.
Wide-bandgap semiconductors are rewriting cost-performance curves. GaN-based laptop adapters show 30% volume shrink at comparable wattage, a selling point for OEMs chasing portability. SiC diodes inside DC-DC converters cut switching losses at 100 kHz, letting designers raise power density without larger heat sinks. Inverter suppliers for electric-vehicle chargers adopt three-level bridge topologies to satisfy strict harmonic limits. Together, these shifts increase average selling prices, supporting healthy margins even as commoditization pressure grows within the power supply units market.
Enclosed chassis units delivered 34.67% of the power supply units (PSU) market in 2025, thanks to IP-rated shells that protect against dust and fluids in harsh industrial lines. The power supply units market share for rack-mount and modular systems, however, is expanding as hyperscale operators enforce N+1 redundancy to drive five-nines availability. Rack-mount and modular designs are expected to have the fastest CAGR of 7.13%. Open-frame designs still dominate the mass market, where cost outstrips maintainability. DIN-rail products, although small in volume, remain vital in building automation because clip-in installation reduces labor.
Standardization is accelerating the pivot to modularity. The Open Rack V3 spec introduced tool-less latches and front-access power bays, a boon for hot-aisle containment strategies. PMBus and I2C telemetry embedded in rack-mount SKUs give operators live readings of ripple and thermal stress, essential for AI-driven facility management. Enclosed supplies now ship with interleaved boost power-factor correction, letting medical OEMs pass IEC 61000-3-2 harmonic limits without bulky filters. These engineering advances keep the power supply units market aligned with serviceability and regulatory trends.
The Power Supply Units (PSU) Market Report is Segmented by Device Type (AC-DC Power Supplies, DC-DC Converters, and DC-AC Inverters), Form Factor (Open-Frame, Enclosed/Chassis, and More), Output-Power Range (Less Than 50 W, 50-250 W, and More), End-User Industry (Industrial Automation and Machinery, Communications and Telecom, and More), and Geography. The Market Forecasts are Provided in Terms of Value (USD).
Geography Analysis
North America contributed 38.87% of 2025 revenue, steered by hyperscale campus construction in Virginia, Oregon and Texas. Amazon Web Services disclosed an USD 11 billion Ohio expansion that alone demands roughly 200 MW of redundant rails. Canada's solar-plus-storage boom feeds inverter demand, yet early pilots of native-DC data centers temper long-term volume for AC-input designs. Component makers benefit from rigorous UL and FCC certifications that act as non-tariff barriers, preserving higher average selling prices in the region's power supply units market.
Asia-Pacific is on track for the fastest 8.09% CAGR through 2031. China's CNY 50 billion (USD 7 billion) subsidy package has begun localizing GaN and SiC fabrication, trimming lead times for domestic PSU assemblers. India's PLI scheme lowered PSU imports 18% in 2025 as Chennai factories scaled to telecom and data-center orders. South Korea's 1,200 ultra-fast EV chargers raise demand for 350 kW cabinets, while Vietnam and Thailand pick up assembly overflow from China. This regional re-balancing intensifies competition and compresses price tiers inside the power supply units market.
Europe remains efficiency-driven, with the revised Ecodesign Directive linking reparability scores to market access by 2027. Germany saw a 12% rise in industrial PSU orders, propelled by automotive electrification rollouts. The United Kingdom upgraded grid infrastructure, pushing utilities to specify smart-grid-compatible inverters. France's nuclear retrofits ask for radiation-hardened supplies, creating a niche premium tier. Meanwhile, Middle East and Africa investments in hyperscale campuses and off-grid solar spark need for high-temperature, dust-protected modules. Geographic divergence in standards complicates portfolio planning, but also shields incumbents who maintain multiple certified variants, reinforcing pricing power in the global power supply units market.
- Delta Electronics Inc.
- Lite-On Technology Corporation
- TDK-Lambda Corporation
- MEAN WELL Enterprises Co., Ltd.
- Emerson Electric Co.
- ABB Ltd.
- Schneider Electric SE
- Siemens AG
- XP Power Limited
- Advanced Energy Industries, Inc.
- AcBel Polytech Inc.
- Murata Manufacturing Co., Ltd.
- CUI Inc.
- Artesyn Embedded Technologies
- Vicor Corporation
- Sea Sonic Electronics Co., Ltd.
- Thermaltake Technology Co., Ltd.
- Micro-Star International Co., Ltd.
- COSEL Co., Ltd.
- Bel Fuse Inc.
- FSP Technology Inc.
Additional Benefits:
- The market estimate (ME) sheet in Excel format
- 3 months of analyst support
TABLE OF CONTENTS
1 INTRODUCTION
- 1.1 Study Assumptions and Market Definition
- 1.2 Scope of the Study
2 RESEARCH METHODOLOGY
3 EXECUTIVE SUMMARY
4 MARKET LANDSCAPE
- 4.1 Market Overview
- 4.2 Market Drivers
- 4.2.1 Rapid Expansion of Hyperscale and Edge Data Centers
- 4.2.2 ATX 3.0 and PCIe 5.1 Upgrade Cycle in Gaming and Workstation PCs
- 4.2.3 Growing Demand For 80 PLUS-Certified Energy-Efficient PSUs
- 4.2.4 Shift Toward 48 V Direct-To-Rack Architectures in Next-Gen Data Centers
- 4.2.5 Proliferation of IoT and Smart-Home Electronics
- 4.2.6 Government e-Waste Directives Driving Modular, Recyclable PSU Designs
- 4.3 Market Restraints
- 4.3.1 Raw-Material Price Volatility for Magnetics and Semiconductors
- 4.3.2 Rising Adoption of Native-DC Facilities Reducing AC-DC PSU Volumes
- 4.3.3 Stricter Global EMI and Safety Certification Costs
- 4.3.4 Fragmented Regional Eco-Design and EPS Efficiency Labeling
- 4.4 Industry Supply-Chain Analysis
- 4.5 Regulatory Landscape
- 4.6 Technological Outlook
- 4.7 Porter's Five Forces Analysis
- 4.7.1 Bargaining Power of Suppliers
- 4.7.2 Bargaining Power of Buyers
- 4.7.3 Threat of New Entrants
- 4.7.4 Threat of Substitutes
- 4.7.5 Intensity of Competitive Rivalry
- 4.8 Impact of Macroeconomic Factors on the Market
5 MARKET SIZE AND GROWTH FORECASTS (VALUE)
- 5.1 By Device Type
- 5.1.1 AC-DC power supplies
- 5.1.2 DC-DC converters
- 5.1.3 DC-AC inverters
- 5.2 By Form Factor
- 5.2.1 Open-frame
- 5.2.2 Enclosed / chassis
- 5.2.3 DIN-rail
- 5.2.4 Brick
- 5.2.5 Rack-mount / modular
- 5.3 By Output-Power Range
- 5.3.1 Less than 50 W
- 5.3.2 50 - 250 W
- 5.3.3 250 - 1 000 W
- 5.3.4 Above 1 000 W
- 5.4 By End-user Industry
- 5.4.1 Industrial Automation and Machinery
- 5.4.2 Communications and Telecom
- 5.4.3 Consumer Electronics and Mobile
- 5.4.4 Automotive (ICE and EV)
- 5.4.5 Transportation (Rail, Avionics, Marine)
- 5.4.6 Medical Devices and Healthcare
- 5.4.7 LED And Lighting
- 5.4.8 Data Centers and Servers
- 5.4.9 Defense and Aerospace
- 5.5 By Geography
- 5.5.1 North America
- 5.5.1.1 United States
- 5.5.1.2 Canada
- 5.5.1.3 Mexico
- 5.5.2 South America
- 5.5.2.1 Brazil
- 5.5.2.2 Argentina
- 5.5.2.3 Rest of South America
- 5.5.3 Europe
- 5.5.3.1 Germany
- 5.5.3.2 United Kingdom
- 5.5.3.3 France
- 5.5.3.4 Italy
- 5.5.3.5 Spain
- 5.5.3.6 Rest of Europe
- 5.5.4 Asia-Pacific
- 5.5.4.1 China
- 5.5.4.2 Japan
- 5.5.4.3 South Korea
- 5.5.4.4 India
- 5.5.4.5 Southeast Asia
- 5.5.4.6 Rest of Asia-Pacific
- 5.5.5 Middle East and Africa
- 5.5.5.1 Middle East
- 5.5.5.1.1 United Arab Emirates
- 5.5.5.1.2 Saudi Arabia
- 5.5.5.1.3 Turkey
- 5.5.5.1.4 Rest of Middle East
- 5.5.5.2 Africa
- 5.5.5.2.1 South Africa
- 5.5.5.2.2 Egypt
- 5.5.5.2.3 Rest of Africa
- 5.5.5.1 Middle East
- 5.5.1 North America
6 COMPETITIVE LANDSCAPE
- 6.1 Market Concentration
- 6.2 Strategic Moves
- 6.3 Market Share Analysis
- 6.4 Company Profiles (Includes Global Level Overview, Market Level Overview, Core Segments, Financials as Available, Strategic Information, Market Rank/Share, Products and Services, and Recent Developments)
- 6.4.1 Delta Electronics Inc.
- 6.4.2 Lite-On Technology Corporation
- 6.4.3 TDK-Lambda Corporation
- 6.4.4 MEAN WELL Enterprises Co., Ltd.
- 6.4.5 Emerson Electric Co.
- 6.4.6 ABB Ltd.
- 6.4.7 Schneider Electric SE
- 6.4.8 Siemens AG
- 6.4.9 XP Power Limited
- 6.4.10 Advanced Energy Industries, Inc.
- 6.4.11 AcBel Polytech Inc.
- 6.4.12 Murata Manufacturing Co., Ltd.
- 6.4.13 CUI Inc.
- 6.4.14 Artesyn Embedded Technologies
- 6.4.15 Vicor Corporation
- 6.4.16 Sea Sonic Electronics Co., Ltd.
- 6.4.17 Thermaltake Technology Co., Ltd.
- 6.4.18 Micro-Star International Co., Ltd.
- 6.4.19 COSEL Co., Ltd.
- 6.4.20 Bel Fuse Inc.
- 6.4.21 FSP Technology Inc.
7 MARKET OPPORTUNITIES AND FUTURE OUTLOOK
- 7.1 White-space and Unmet-need Assessment

