
PUBLISHER: Mordor Intelligence | PRODUCT CODE: 2044032

PUBLISHER: Mordor Intelligence | PRODUCT CODE: 2044032
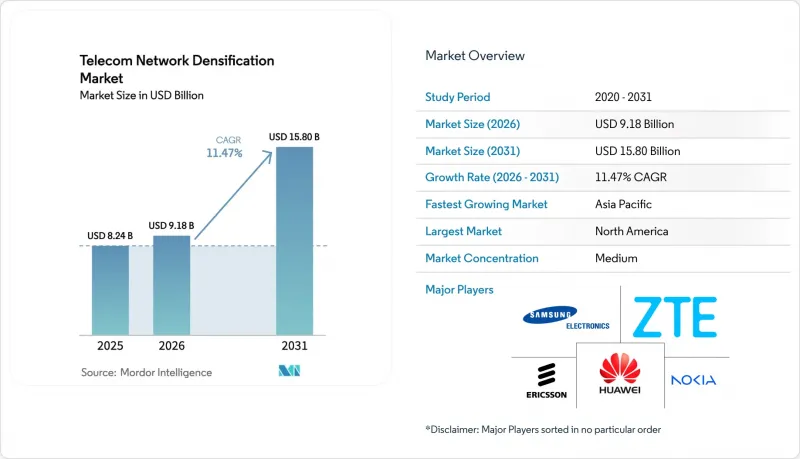
Telecom Network Densification - Market Share Analysis, Industry Trends & Statistics, Growth Forecasts (2026 - 2031)
The Telecom Network Densification Market size is expected to grow from USD 8.24 billion in 2025 to USD 9.18 billion in 2026 and is forecast to reach USD 15.80 billion by 2031 at 11.47% CAGR over 2026-2031.
Operators are accelerating deployments of small cells, distributed antenna systems, and millimeter-wave nodes because monthly mobile data traffic jumped 25% year-on-year through 2025, while macro-cell capacity in dense districts plateaued. Indoor systems dominate because stadiums, airports, and enterprise campuses demand guaranteed coverage, yet streamlined street-level permitting is unlocking a second growth wave for outdoor nodes. Hybrid sub-6 GHz plus mmWave architectures are gaining traction as carriers blend wide-area reach with multi-gigabit hotspots, and neutral-host business models are expanding as building owners monetize shared infrastructure. Government 5G stimulus programs further reduce risk, but backhaul fiber scarcity and fragmented municipal rules continue to temper rollout velocity.
Global Telecom Network Densification Market Trends and Insights
Surging Mobile Data Traffic and 5G Subscription Growth
Global mobile data consumption reached 140 exabytes per month in 2025, a 25% increase from 2024, and 5G subscriptions are on track to reach 5.6 billion by 2029. Macro-cell throughput in high-density corridors now levels off at around 10 Gbps, even with advanced carrier aggregation, compelling operators to increase site counts. Video streaming and cloud gaming already account for 70% of traffic, and forthcoming extended-reality services will further intensify uplink demand. Early movers that densify networks secure premium subscribers seeking stable gigabit performance, whereas laggards risk churn toward rivals with consistent quality of experience. Equipment vendors benefit as operators bundle densification with edge compute, raising average selling prices. Consequently, the Telecom network densification market continues to post double-digit gains despite macroeconomic uncertainty.
Urban Capacity Crunch Spurring Small-Cell and mmWave Rollout
Cell-edge throughput in inner-city hot spots often dips below 50 Mbps during evening peaks, even under full 5G macro coverage, mainly due to interference and high user density. Carriers therefore affix small cells to lamp posts, utility poles, and facades to shrink the radio footprint and lift per-user bandwidth. EE, for instance, activated more than 1,500 urban small cells across London by mid-2025, relieving traffic on congested macro layers. However, mmWave radios experience 20-30 dB higher path loss than sub-6 GHz radios, requiring 5-10 times as many sites to blanket the same geography. Municipalities that streamline single-touch permitting, such as San Jose's "dig-once" policy, attract greater operator capital, whereas fragmented approval chains can delay node activation by over a year.
Complex Site Acquisition and Permitting in Dense Cities
Municipal codes drafted for macro towers seldom accommodate devices the size of a backpack bolted to streetlights. New York City historically required up to 24 months for approvals, whereas Los Angeles cut timelines to 90 days via a master license on all city-owned poles. The federal caps of USD 270 per node annually, imposed by the FCC in 2018, are facing ongoing legal challenges, creating uncertainty for CAPEX planning. Carriers deploying thousands of nodes must negotiate with transportation, public works, and heritage bodies, each with its own workflows. Neutral-host aggregators reduce red tape but often capture 30-40% margins, increasing the total cost of ownership. Hence, slow permitting remains the most immediate drag on the expansion of the Telecom network densification market in capital-intensive urban cores.
Other drivers and restraints analyzed in the detailed report include:
- Government and Operator 5G Infrastructure Investments
- Enterprise/Private-5G Demand for Ultra-Low-Latency Links
- Backhaul-Fiber Availability and Cost Constraints
For complete list of drivers and restraints, kindly check the Table Of Contents.
Segment Analysis
Indoor sites accounted for 64.56% of 2025 revenue, the largest Telecom network densification market share for any single segment. Airports, arenas, and corporate campuses deliver concurrent user densities above 50,000 per square kilometer, far exceeding outdoor macro limits. Indoor small cells and distributed-antenna systems thus enable 10-to-100-fold capacity gains per square meter. Municipalities rarely govern in-building installations, allowing property owners to contract with neutral hosts directly and minimizing permitting delays.
Outdoor nodes will grow at a 12.41% CAGR, powered by lamp-post and utility-pole deployments along transit and retail corridors. FCC preemption of excessive municipal fees trimmed average approval timelines from 18 months to under 90 days in compliant jurisdictions. Cities adopting master-license frameworks consolidate power supply, pole access, and fiber attachment requests, reducing operator friction. Balanced build plans, indoor for guaranteed quality and outdoor for mobility, help carriers achieve uniform gigabit service and maximize Telecom network densification market size returns.
Sub-6 GHz coverage preserved 43.91% of 2025 spending because a 500-1,000-meter radius keeps site counts and CAPEX manageable. However, hybrid sub-6 GHz + mmWave approaches will post a 12.98% CAGR through 2031 as operators layer wide-area coverage with multi-gigabit hotspots. The United States' USD 81 billion C-band auction set the pace, while Japan's NTT Docomo achieved 4 Gbps downlink in Tokyo's Shibuya district using 28 GHz mmWave within 100 meters of base stations.
Pure mmWave remains specialized for stadiums, airports, and dense downtown blocks, due to 20-30 dB higher path loss than sub-6 GHz. Release-17 dual-connectivity enables devices to connect to both bands simultaneously, optimizing spectral efficiency and user experience. Operators mastering interference mitigation and load balancing across heterogeneous bands protect spectrum ROI and expand the Telecom network densification market.
The Telecom Network Densification Market Report is Segmented by Deployment Location (Indoor and Outdoor), Spectrum Band (Sub-6 GHz, Mmwave (24-71 GHz), and Hybrid Sub-6 + MmWave), Application (Enhanced Mobile Broadband (eMBB), Fixed Wireless Access (FWA), and More), End User (Telecom Operators, Enterprises and Private-Network Hosts, and More), and Geography. The Market Forecasts are in Value (USD).
Geography Analysis
North America retained 24.56% of 2025 turnover, underpinned by C-band deployments and the activation of 50,000 new small cells during the year. Canada's nationwide 3.5 GHz rollout extends coverage to rural communities, while Mexico's infrastructure-sharing mandate unlocks lower-CAPEX expansions. Robust neutral-host ecosystems and clear permitting rules keep investment momentum high, though heritage zones remain deployment bottlenecks.
Asia-Pacific is set to outpace every region, with a 13.04% CAGR through 2031, and will soon command the largest Telecom network densification market share. China Mobile alone operates 2.3 million 5G base stations, while India's Jio and Airtel plan to deploy 1 million small cells by 2027. Japan and South Korea lead mmWave adoption, while ASEAN nations accelerate auctions to fuel digital-economy goals. Governmental subsidies and industrial-park incentives minimize risk and concentrate early densification in high-GDP corridors.
Europe maintains a mid-teens share, and the EU's 5G Action Plan mandates coverage along all transport corridors by 2030, which translates into dense roadside node deployments. GCC nations leverage smart-city visions, the Dubai Expo, and Saudi Vision 2030 to densify networks swiftly, generating high per-user revenue. Africa and South America lag but exhibit high percentage growth from low bases, with Nigeria's and Brazil's recent spectrum awards jump-starting pilot rollouts. Diverse regulatory rhythms mean global vendors must tailor their go-to-market strategies by region to capture their share of the growth in the Telecom network densification market.
- Huawei Technologies Co., Ltd.
- Telefonaktiebolaget LM Ericsson
- Nokia Corporation
- Samsung Electronics Co., Ltd.
- ZTE Corporation
- Qualcomm Technologies, Inc.
- CommScope Holding Company, Inc.
- Airspan Networks Holdings Inc.
- Mavenir Systems, Inc.
- NEC Corporation
- Fujitsu Limited
- Corning Incorporated
- Cisco Systems, Inc.
- Baicells Technologies Co., Ltd.
- ip.access Limited
- Radisys Corporation
- John Mezzalingua Associates, LLC
- Parallel Wireless, Inc.
- Boldyn Networks
Additional Benefits:
- The market estimate (ME) sheet in Excel format
- 3 months of analyst support
TABLE OF CONTENTS
1 INTRODUCTION
- 1.1 Study Assumptions and Market Definition
- 1.2 Scope of the Study
2 RESEARCH METHODOLOGY
3 EXECUTIVE SUMMARY
4 MARKET LANDSCAPE
- 4.1 Market Overview
- 4.2 Market Drivers
- 4.2.1 Surging Mobile Data Traffic and 5G Subscription Growth
- 4.2.2 Urban Capacity Crunch Spurring Small-Cell and mmWave Rollout
- 4.2.3 Government and Operator 5G Infrastructure Investments
- 4.2.4 Enterprise/Private-5G Demand for Ultra-Low-Latency Links
- 4.2.5 AI-Optimized Smart Repeaters Lowering Deployment CAPEX
- 4.2.6 Integrated Access and Backhaul (IAB) Enabling Fiber-Lean Roll-Outs
- 4.3 Market Restraints
- 4.3.1 Complex Site Acquisition and Permitting in Dense Cities
- 4.3.2 Backhaul-Fiber Availability and Cost Constraints
- 4.3.3 DL/UL Power Imbalance at mmWave Bands
- 4.3.4 Energy-Use Escalation Vs. Sustainability Targets
- 4.4 Industry Value Chain Analysis
- 4.5 Regulatory Landscape
- 4.6 Technological Outlook
- 4.7 Porter's Five Forces Analysis
- 4.7.1 Threat of New Entrants
- 4.7.2 Bargaining Power of Suppliers
- 4.7.3 Bargaining Power of Buyers
- 4.7.4 Threat of Substitutes
- 4.7.5 Competitive Rivalry
5 MARKET SIZE AND GROWTH FORECASTS (VALUE)
- 5.1 By Deployment Location
- 5.1.1 Indoor
- 5.1.2 Outdoor
- 5.2 By Spectrum Band
- 5.2.1 Sub-6 GHz
- 5.2.2 mmWave (24-71 GHz)
- 5.2.3 Hybrid Sub-6 + mmWave
- 5.3 By Application
- 5.3.1 Enhanced Mobile Broadband (eMBB)
- 5.3.2 Fixed Wireless Access (FWA)
- 5.3.3 Industrial IoT/Industry 4.0
- 5.3.4 Smart Cities and Public Venues
- 5.3.5 Mission-Critical and Public Safety
- 5.3.6 Connected and Autonomous Mobility (V2X)
- 5.4 By End User
- 5.4.1 Telecom Operators
- 5.4.2 Enterprises and Private-Network Hosts
- 5.4.3 Neutral-Host Providers
- 5.4.4 Government and Public Safety
- 5.4.5 Residential/Consumers
- 5.5 By Geography
- 5.5.1 North America
- 5.5.1.1 United States
- 5.5.1.2 Canada
- 5.5.1.3 Mexico
- 5.5.2 South America
- 5.5.2.1 Brazil
- 5.5.2.2 Argentina
- 5.5.2.3 Rest of South America
- 5.5.3 Europe
- 5.5.3.1 Germany
- 5.5.3.2 United Kingdom
- 5.5.3.3 France
- 5.5.3.4 Italy
- 5.5.3.5 Spain
- 5.5.3.6 Russia
- 5.5.3.7 Rest of Europe
- 5.5.4 Asia-Pacific
- 5.5.4.1 China
- 5.5.4.2 Japan
- 5.5.4.3 South Korea
- 5.5.4.4 India
- 5.5.4.5 ASEAN
- 5.5.4.6 Rest of Asia-Pacific
- 5.5.5 Middle East and Africa
- 5.5.5.1 GCC
- 5.5.5.2 South Africa
- 5.5.5.3 Nigeria
- 5.5.5.4 Rest of Middle East and Africa
- 5.5.1 North America
6 COMPETITIVE LANDSCAPE
- 6.1 Market Concentration
- 6.2 Strategic Moves
- 6.3 Market Share Analysis
- 6.4 Company Profiles (includes Global level Overview, Market level overview, Core Segments, Financials as available, Strategic Information, Market Rank/Share for key companies, Products and Services, and Recent Developments)
- 6.4.1 Huawei Technologies Co., Ltd.
- 6.4.2 Telefonaktiebolaget LM Ericsson
- 6.4.3 Nokia Corporation
- 6.4.4 Samsung Electronics Co., Ltd.
- 6.4.5 ZTE Corporation
- 6.4.6 Qualcomm Technologies, Inc.
- 6.4.7 CommScope Holding Company, Inc.
- 6.4.8 Airspan Networks Holdings Inc.
- 6.4.9 Mavenir Systems, Inc.
- 6.4.10 NEC Corporation
- 6.4.11 Fujitsu Limited
- 6.4.12 Corning Incorporated
- 6.4.13 Cisco Systems, Inc.
- 6.4.14 Baicells Technologies Co., Ltd.
- 6.4.15 ip.access Limited
- 6.4.16 Radisys Corporation
- 6.4.17 John Mezzalingua Associates, LLC
- 6.4.18 Parallel Wireless, Inc.
- 6.4.19 Boldyn Networks
7 MARKET OPPORTUNITIES AND FUTURE OUTLOOK
- 7.1 White-Space and Unmet-Need Assessment
- 7.2 Analyst Recommendations and Suggestions

