
PUBLISHER: Mordor Intelligence | PRODUCT CODE: 2044047

PUBLISHER: Mordor Intelligence | PRODUCT CODE: 2044047
Telecom Generative AI Applications - Market Share Analysis, Industry Trends & Statistics, Growth Forecasts (2026 - 2031)
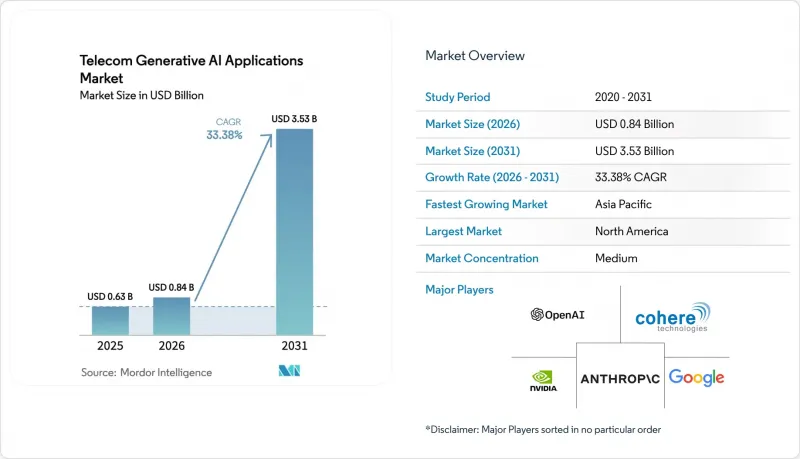
The Telecom Generative AI Applications Market size was valued at USD 0.63 billion in 2025 and is estimated to grow from USD 0.84 billion in 2026 to reach USD 3.53 billion by 2031, at a CAGR of 33.38% during the forecast period (2026-2031).
Generative AI is shifting from small-scale chatbots to production-grade platforms that automate network orchestration, fraud detection, and predictive maintenance, replacing manual workflows that once dominated operations. North American operators are leading cost-optimization efforts, exemplified by AT&T's 90% drop in inference costs after deploying a multi-model routing fabric that allocates queries to the cheapest model that meets accuracy thresholds. Infrastructure vendors now embed AI as a native layer. Ericsson and Google Cloud's 5G core-as-a-service offering speaks directly to this trend, bundling real-time policy tuning into the core software rather than selling it as an extra module. Equipment makers and hyperscalers are racing to lock in early adopter contracts, so the Telecom generative AI applications market is moving from experimentation to mainstream capital budgeting.
Global Telecom Generative AI Applications Market Trends and Insights
Generative-AI Powered Network Automation
Operators are field-testing multi-agent systems that auto-adjust radio parameters, reroute traffic, and provision network slices in seconds, replacing hours-long manual tasks. Deutsche Telekom's proof-of-concept reduced human configuration work by 40% across 50,000 cell sites, freeing engineers for strategic planning. Nokia and AWS reenacted a live demo at Mobile World Congress 2025 in which virtual assistants negotiated quality-of-service targets in natural language, removing the need for dedicated provisioning portals. Labor shortages in mature markets magnify ROI because AI inference costs undercut the fully loaded cost of radio-frequency engineers. The caveat is that true real-time control depends on dense edge-compute nodes; operators missing that layer will incur latency penalties, pushing them to launch network modernization programs in parallel with AI rollouts.
Hyper-Personalized Customer Experience Solutions
First-generation chatbots delivered static FAQ responses, but generative AI now tailors offers and troubleshooting steps to each subscriber's device, location, and history, yielding 20-30% higher conversion in pilot runs. Verizon blended Google's Gemini model into its support stack and shortened average handle time by 18%, a hard metric that finance teams recognize. Salesforce observed a 25% upsell lift when AI-curated recommendations were pushed via SMS, underlining that delivery channel and model output must co-evolve. Prepaid markets reap the fastest gains because operators iterate offers within minutes, but privacy statutes in Europe and California require explicit consent for behavioral analytics, stretching deployment roadmaps in high-value regions.
High Inference Cost on Legacy Core Networks
Many operators still lean on legacy packet-core hardware that was never designed for the compute-intensive workloads of generative models. When those aging switches and EPC platforms attempt real-time inference, the silicon bottlenecks push per-query charges up to USD 0.002 on public endpoints, 20 times the rate achieved on modern, AI-optimized cores. Carriers in low-ARPU regions feel the squeeze most acutely because even modest AI adoption can swamp thin operating margins. As a result, boards in parts of Africa, Latin America, and Southeast Asia are shelving customer-facing use cases and instead reserving scarce capacity for fraud detection and other back-office tasks that deliver a clearer return on spend.
Other drivers and restraints analyzed in the detailed report include:
- Surge in AI-Native 5G Stand-Alone Deployments
- Cost Deflation via Large Language Model Optimization
- Evolving Standards Fragmentation Across Regions
For complete list of drivers and restraints, kindly check the Table Of Contents.
Segment Analysis
Software retained 48.72% of the Telecom generative AI applications market share in 2025, owing to telco-tuned foundation models delivered as consumable APIs. Hardware shipments decelerated as inference-optimized chips deliver 10X the performance per watt, enabling carriers to install fewer accelerators per data center. Conversely, services revenue is clocking a 35.40% CAGR, reflecting operator preference for managed fine-tuning and compliance outsourcing. The Telecom generative AI applications market size for services is projected to climb from USD 0.26 billion in 2026 to USD 1.38 billion by 2031 as MSPs introduce outcome-based pricing.
Competitive differentiation in services now pivots on governance. Amdocs and IBM position unified control planes that handle version tracking, prompt logging, and regulator-ready audit trails. Hardware vendors such as NVIDIA partner with Nokia to pre-integrate accelerators into base stations, collapsing the boundaries between boxes and code. Operators thus negotiate bundles instead of line-item licenses, compressing procurement cycles and magnifying vendor bargaining power.
Customer service automation maintained a 27.81% share in 2025, as chatbots deflected tier-1 queries. Yet predictive maintenance will command the fastest growth, as the Telecom generative AI applications market devoted to predictive maintenance is forecast to expand at a 37.01% CAGR, taking share as AI agents pre-empt failures 72 hours before they occur. Nokia's roll-out across 15 networks saved USD 50 million per carrier by cutting truck rolls and slashing mean time to repair to 2 hours.
Fraud detection and security workloads rise in tandem as adversaries generate synthetic voices and spoofed traffic; Pindrop's platform reduced account takeovers by 40% at North American telcos. Network optimization uses generative models to stress-test digital twins under congestion, while marketing personalization remains a smaller slice but earns budget in prepaid battlegrounds where churn tops 30% annually. Convergence across use cases favors unified platforms that pool telemetry and retrain shared embeddings, reducing redundant compute spend.
The Telecom Generative AI Applications Market Report is Segmented by Component (Hardware, Software, and More), Application (Customer Service Automation, Network Optimization, and More), Deployment Model (Cloud, On-Premise, and Edge), Telecom Operator Type (Mobile Network Operators, Fixed-Line Operators, and More), and Geography. The Market Forecasts are Provided in Terms of Value (USD).
Geography Analysis
North America retained 35.88% share in 2025 as FCC explainability rules sharpened demand for audit-friendly platforms and proximity to hyperscaler regions compressed integration timelines. AT&T's plunge in inference costs illustrates the region's focus on opex efficiency, while Canada's disclosure mandates slowed front-office AI but nurtured customer trust. Mexico's draft guidelines tilt the compliance burden toward larger players able to absorb legal costs, consolidating share.
Asia-Pacific will register a 36.72% CAGR, the highest worldwide, propelled by China Mobile's 10 billion Call Detail Record model and Reliance Jio's AI-enabled MyJio app handling 50 million daily queries. Japan's NTT DoCoMo offers conversational network slicing; SK Telecom's churn predictor reduced attrition by 1.2 points. Australia, burdened by strict liability laws, confines AI to back-office scenarios.
Europe is growing more slowly due to the EU AI Act's high-risk label, but Telia's GDPR-compliant slice configurator shows that compliance paths are viable. Deutsche Telekom's 40% cut in manual tasks shows that productivity gains can coexist with regulation. The Middle East invests aggressively in AI-native 5G to power smart-city agendas; du's bilingual chatbot exemplifies regional localization. Latin America's uptake centers on Brazilian fraud-detection projects, whereas Argentina delays due to macroeconomic volatility. Africa faces cloud scarcity, but South Africa and Nigeria test edge AI for rural optimization, highlighting latent potential.
- OpenAI LP
- Cohere Technologies Inc.
- Anthropic PBC
- NVIDIA Corporation
- Google LLC
- Microsoft Corporation
- Amazon Web Services Inc.
- IBM Corporation
- Huawei Technologies Co. Ltd.
- Ericsson AB
- Nokia Corporation
- Amdocs Limited
- Juniper Networks Inc.
- Ciena Corporation
- Rakuten Symphony Inc.
- Salesforce Inc.
- ServiceNow Inc.
- Alteryx Inc.
- Telia Company AB
- AT&T Inc.
Additional Benefits:
- The market estimate (ME) sheet in Excel format
- 3 months of analyst support
TABLE OF CONTENTS
1 INTRODUCTION
- 1.1 Study Assumptions and Market Definition
- 1.2 Scope of the Study
2 RESEARCH METHODOLOGY
3 EXECUTIVE SUMMARY
4 MARKET LANDSCAPE
- 4.1 Market Overview
- 4.2 Market Drivers
- 4.2.1 Generative-AI Powered Network Automation
- 4.2.2 Hyper-Personalized Customer Experience Solutions
- 4.2.3 Surge in AI-Native 5G Stand-Alone Deployments
- 4.2.4 Cost Deflation via Large Language Model Optimization
- 4.2.5 Ecosystem Push for Open RAN and ORAN-Aligned AI Toolkits
- 4.2.6 Telco-specific Foundation Models and Verticalized APIs
- 4.3 Market Restraints
- 4.3.1 Hallucination-Driven Regulatory Non-Compliance Risk
- 4.3.2 Scarcity of Telecom-Grade Annotated Data Assets
- 4.3.3 High Inference Cost on Legacy Core Networks
- 4.3.4 Evolving Standards Fragmentation Across Regions
- 4.4 Industry Value Chain Analysis
- 4.5 Regulatory Landscape
- 4.6 Technological Outlook
- 4.7 Impact of Macroeconomic Factors
- 4.8 Porter's Five Forces Analysis
- 4.8.1 Threat of New Entrants
- 4.8.2 Bargaining Power of Suppliers
- 4.8.3 Bargaining Power of Buyers
- 4.8.4 Threat of Substitute Products
- 4.8.5 Intensity of Competitive Rivalry
5 MARKET SIZE AND GROWTH FORECASTS (VALUE)
- 5.1 By Component
- 5.1.1 Hardware
- 5.1.2 Software
- 5.1.3 Services
- 5.2 By Application
- 5.2.1 Customer Service Automation
- 5.2.2 Network Optimization
- 5.2.3 Fraud Detection and Security
- 5.2.4 Predictive Maintenance
- 5.2.5 Marketing Personalization
- 5.3 By Deployment Model
- 5.3.1 Cloud
- 5.3.2 On-Premise
- 5.3.3 Edge
- 5.4 By Telecom Operator Type
- 5.4.1 Mobile Network Operators
- 5.4.2 Fixed-Line Operators
- 5.4.3 Internet Service Providers
- 5.4.4 Mobile Virtual Network Operators
- 5.5 By Geography
- 5.5.1 North America
- 5.5.1.1 United States
- 5.5.1.2 Canada
- 5.5.1.3 Mexico
- 5.5.2 South America
- 5.5.2.1 Brazil
- 5.5.2.2 Argentina
- 5.5.2.3 Rest of South America
- 5.5.3 Europe
- 5.5.3.1 Germany
- 5.5.3.2 United Kingdom
- 5.5.3.3 France
- 5.5.3.4 Russia
- 5.5.3.5 Rest of Europe
- 5.5.4 Asia-Pacific
- 5.5.4.1 China
- 5.5.4.2 Japan
- 5.5.4.3 India
- 5.5.4.4 South Korea
- 5.5.4.5 Rest of Asia-Pacific
- 5.5.5 Middle East and Africa
- 5.5.5.1 Middle East
- 5.5.5.1.1 Saudi Arabia
- 5.5.5.1.2 United Arab Emirates
- 5.5.5.1.3 Rest of the Middle East
- 5.5.5.2 Africa
- 5.5.5.2.1 South Africa
- 5.5.5.2.2 Nigeria
- 5.5.5.2.3 Rest of Africa
- 5.5.5.1 Middle East
- 5.5.1 North America
6 COMPETITIVE LANDSCAPE
- 6.1 Market Concentration
- 6.2 Strategic Moves
- 6.3 Market Share Analysis
- 6.4 Company Profiles (includes Global level Overview, Market level overview, Core Segments, Financials as available, Strategic Information, Market Rank/Share for key companies, Products and Services, and Recent Developments)
- 6.4.1 OpenAI LP
- 6.4.2 Cohere Technologies Inc.
- 6.4.3 Anthropic PBC
- 6.4.4 NVIDIA Corporation
- 6.4.5 Google LLC
- 6.4.6 Microsoft Corporation
- 6.4.7 Amazon Web Services Inc.
- 6.4.8 IBM Corporation
- 6.4.9 Huawei Technologies Co. Ltd.
- 6.4.10 Ericsson AB
- 6.4.11 Nokia Corporation
- 6.4.12 Amdocs Limited
- 6.4.13 Juniper Networks Inc.
- 6.4.14 Ciena Corporation
- 6.4.15 Rakuten Symphony Inc.
- 6.4.16 Salesforce Inc.
- 6.4.17 ServiceNow Inc.
- 6.4.18 Alteryx Inc.
- 6.4.19 Telia Company AB
- 6.4.20 AT&T Inc.
7 MARKET OPPORTUNITIES AND FUTURE OUTLOOK
- 7.1 White-Space and Unmet-Need Assessment
- 7.2 Analyst Recommendations and Suggestions

