
PUBLISHER: Mordor Intelligence | PRODUCT CODE: 2044080

PUBLISHER: Mordor Intelligence | PRODUCT CODE: 2044080
Plastic Waste Management - Market Share Analysis, Industry Trends & Statistics, Growth Forecasts (2026 - 2031)
The Plastic Waste Management Market size is expected to grow from USD 48.10 billion in 2025 to USD 49.81 billion in 2026 and is forecast to reach USD 59.31 billion by 2031 at 3.55% CAGR over 2026-2031.
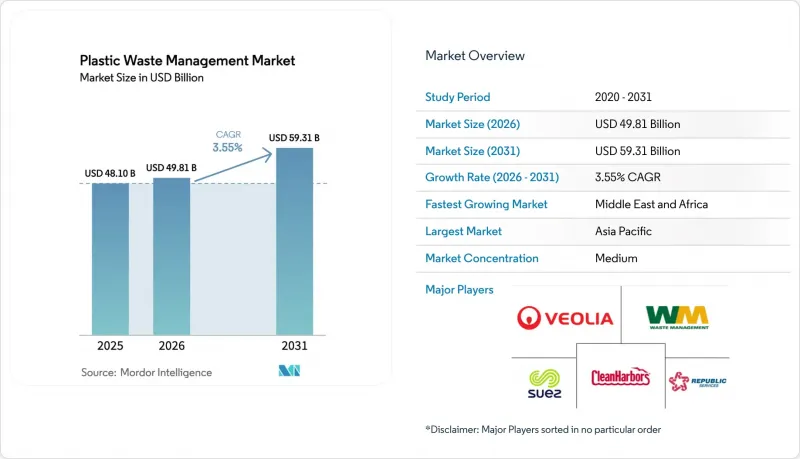
Tightening regulations, notably Extended Producer Responsibility (EPR) schemes across more than 25 jurisdictions, are pushing stakeholders to redesign packaging and invest in recovery systems that meet recycled-content mandates. Asia-Pacific retains the highest regional demand as well as the largest installed recycling base, while the Middle East and Africa outpace other regions as governments adopt ambitious landfill-diversion targets. Investment momentum is shifting from traditional disposal toward advanced chemical recycling, supported by private "circularity" funds and corporate off-take agreements that de-risk new capacity. On-site AI-powered optical sorters are cutting Material Recovery Facility operating costs by up to 25%, improving feedstock quality and bolstering recyclate margins even when virgin polymer prices soften.
Global Plastic Waste Management Market Trends and Insights
Extended Producer-Responsibility (EPR) Mandates Accelerating Fee-based Collection in EU & Canada
EPR systems are reshaping economics by shifting collection and processing costs onto producers, creating direct incentives to reduce material weight and increase recycled content. The EU regulation, effective February 2025, sets a 30% recycled-PET requirement for food packaging by 2030, while Canadian provinces such as British Columbia already record 79.6% recovery rates under mature schemes. Emerging US state programs in California, Minnesota, and others mirror this approach, signalling continent-wide convergence. Producers now budget for compliance fees alongside raw-material purchasing, making design-for-recycling and closed-loop sourcing central to cost control and brand reputation.
China's Ban on Low-grade Scrap Imports Boosting Domestic Recycling Margins in Asia
China's 2017 prohibition on most plastic scrap imports forced exporters to improve bale purity or divert shipments elsewhere, simultaneously widening domestic profit margins for licensed recyclers. The State Council's circular-economy plan targets 4.5 billion tons of annual resource recycling by 2025, and PET beverage containers already achieve 96.48% recovery. Regional hubs in Guangdong and Zhejiang sell flakes into both domestic packaging and export markets, demonstrating that higher local feedstock prices can coexist with global arbitrage opportunities. Neighboring ASEAN members have responded with quality standards to avoid becoming low-grade dumps, reinforcing regional capacity build-out.
Plastic Overproduction and Overconsumption Strain Waste Management, Hindering Recycling and Circular-economy Efforts
Global polymer output hit 400.3 million tons in 2022 and could double by 2035, overwhelming existing collection networks and depressing recyclate prices when supply outpaces end-market demand. Only 9% of plastic waste is recycled worldwide, with 22% mismanaged in Africa, where 65% of marine leakage originates. Overcapacity also lowers virgin-polymer prices, undermining recycled-content economics absent policy-mandated offtake.
Other drivers and restraints analyzed in the detailed report include:
- Rapid Scale-up of Advanced (Pyrolysis & Solvolysis) Recycling Facilities in U.S. Gulf Coast
- Corporate-backed Circularity Funds De-risking Infrastructure Projects
- Negative Netbacks for Recycled PE & PP When Brent Less Than USD 55/barrel
For complete list of drivers and restraints, kindly check the Table Of Contents.
Segment Analysis
Polyethylene held 32.28% of plastic waste management market share in 2025, reflecting its dominance in flexible and rigid packaging streams. Robust curbside programs and widespread mechanical-recycling infrastructure support steady volumes. Yet PET is the fastest-growing polymer segment, expanding at a 5.82% CAGR on the back of bottle-to-bottle mandates such as the EU's 30% recycled-content rule by 2030. China's closed-loop system already recovers 96.48% of PET beverage bottles, creating high-quality flake for domestic converters. As more food-grade depolymerization plants come on stream, PET positions itself as the preferred material for high-specification recycling applications.
Demand dynamics go beyond regulation. PET's chemical structure allows solvent-based depolymerization that returns resin to monomer purity, facilitating infinite reuse without property loss. Polypropylene and polystyrene lag because of contamination and limited end-markets, while PVC recycling gains traction through AI-assisted pre-sorting systems and high-efficiency shredders. Technology developers now target mixed-polymer pyrolysis that yields hydrocarbons for refinery feedstocks or hydrogen co-products. Such diversification may temper PE's lead, but its scale and low-cost collection ensure continued relevance in the plastic waste management market.
Industrial generators contributed 51.74% of total plastic waste volumes in 2025, benefiting from homogenous material flows and lower contamination. Manufacturing off-cuts, distribution film, and pre-consumer scrap feed specialized plants that achieve higher recovery yields and enjoy predictable input pricing. Residential waste streams are projected to grow fastest at 6.08% CAGR through 2031, as municipalities roll out standardized bins, anti-contamination education, and smart cameras. King County's pilot reduced contamination below the critical 12% threshold, unlocking higher bale values.
Residential expansion is underpinned by EPR fee revenue that finances household collection upgrades. Smart-sensor trials in Rhode Island cut rejected tonnage, saving taxpayers millions in hauling charges. Industrial streams will still command premium contracts because scale simplifies logistics, yet the broadest tonnage uplift will come from homes as digital route optimization reduces the per-household cost of collection. The plastic waste management market, therefore, pivots toward solutions that reconcile small-lot pick-ups with material purity standards.
The Plastic Waste Management Market Report is Segmented by Polymer Type (Polyethylene (PE), Polypropylene (PP), and More), by Source (Industrial, Residential, and More), by Service Type (Disposal/Treatment, and More), by End-Use Industry (Packaging, Automotive, and More), and by Geography (Asia-Pacific, North America, Europe, and More). The Report Offers Market Size and Forecasts in Value (USD) for all the Above Segments.
Geography Analysis
Asia-Pacific generated 40.21% of global revenue in 2025 and remains the anchor of the plastic waste management market. China's circular-economy policies aim for 4.5 billion tons of annual resource recycling by 2025, and India's July 2025 barcode mandate improves producer accountability. Japan posts an 11% reduction in plastic waste but still needs stricter enforcement to hit 2030 benchmarks. Indonesia relies on community "waste banks" and private haulers to tackle its 58% uncollected rate, while Vietnam's pilot circular-city programs showcase integrated collection and treatment paths. Foreign direct investment flows into regional hubs where high bale prices offset infrastructure risk, maintaining Asia's leadership despite rising compliance costs.
The Middle East and Africa segment in the plastic waste management market holds the fastest growth trajectory at 6.09% CAGR to 2031. Saudi Arabia's Vision 2030 targets 94% landfill diversion, supported by more than 840 treatment centers and a plan to divide waste management into 25 regional clusters. Egypt formally enacted EPR on shopping bags in March 2025, spurring private-sector sorting and pelletizing projects. The UAE's single-use plastic ban, effective January 2025, adds tariffs on carrier bags and imposes data-reporting duties. Africa overall recycles only 9% of its plastic, but donor-funded projects and rising urban-waste tipping fees create a medium-term runway for technology transfer.
Europe sustains regulatory leadership through the Packaging and Packaging Waste Regulation that demands all packaging be recyclable by 2030 and sets a 30% rPET threshold. Harmonized EPR fees across member states cut administrative burdens and fund trans-frontier waste-tracking systems. Canada mirrors success with British Columbia's 79.6% recovery under full producer funding, and Alberta's framework goes live in April 2025. In the United States, the EPA's National Strategy to Prevent Plastic Pollution presses voluntary action but also encourages state-level EPR adoption. Cross-border material flows adjust as exporters seek high-quality bale outlets after China's import ban, underscoring the plastic waste management market's shift toward localized circular loops.
- Veolia Environnement SA
- SUEZ SA
- Waste Management Inc.
- Republic Services Inc.
- Clean Harbors Inc.
- Remondis SE & Co. KG
- Biffa PLC
- Stericycle Inc.
- Covanta Holding Corp.
- TOMRA Systems ASA
- Plastic Energy Ltd.
- Brightmark LLC
- Agilyx Corporation
- TerraCycle Inc.
- Waste Connections Inc.
- DS Smith PLC
- Borealis AG
- LyondellBasell Industries NV
- Marius Pedersen A/S
Additional Benefits:
- The market estimate (ME) sheet in Excel format
- 3 months of analyst support
TABLE OF CONTENTS
1 Introduction
- 1.1 Study Assumptions & Market Definition
- 1.2 Scope of the Study
2 Research Methodology
3 Executive Summary
4 Market Insights and Dynamics
- 4.1 Market Overview
- 4.2 Market Drivers
- 4.2.1 Extended Producer-Responsibility (EPR) Mandates Accelerating Fee-Based Collection in EU & Canada
- 4.2.2 China's Ban on Low-Grade Scrap Imports Boosting Domestic Recycling Margins in Asia
- 4.2.3 Rapid Scale-up of Advanced (Pyrolysis & Solvolysis) Recycling Facilities in U.S. Gulf Coast
- 4.2.4 Corporate-Backed Circularity Funds (e.g., Closed Loop Partners) De-Risking Infrastructure Projects
- 4.2.5 AI-Driven Optical Sorting Lines Cutting OPEX by 18-25 % in MRFs
- 4.2.6 FMCG Re-design toward Mono-Material Flexible Packaging Lifting Recoverable Volumes
- 4.3 Market Restraints
- 4.3.1 Plastic overproduction and overconsumption strain waste management, hindering recycling and circular economy efforts
- 4.3.2 Negative Netbacks for Recycled PE & PP When Brent < US$55/bbl
- 4.3.3 High Contamination (>12 %) in Curb-Side Streams Limiting Mechanical Recyclate Quality
- 4.3.4 Carbon-Tax Exemptions for Incineration Undercutting Recycling Economics in Nordics
- 4.4 Value / Supply-Chain Analysis
- 4.5 Regulatory Outlook
- 4.6 Technological Outlook
- 4.7 Industry Attractiveness - Porter's Five Forces
- 4.7.1 Bargaining Power of Suppliers
- 4.7.2 Bargaining Power of Buyers
- 4.7.3 Threat of New Entrants
- 4.7.4 Threat of Substitutes
- 4.7.5 Intensity of Rivalry
- 4.8 Investment & Capacity Expansion Analysis
5 Market Size & Growth Forecasts (Value, In USD Billion)
- 5.1 By Polymer Type
- 5.1.1 Polyethylene (PE)
- 5.1.2 Polypropylene (PP)
- 5.1.3 Polyethylene Terephthalate (PET)
- 5.1.4 Polystyrene (PS)
- 5.1.5 Polyvinyl Chloride (PVC)
- 5.1.6 Other Polymers (ABS, PA, etc.)
- 5.2 By Source
- 5.2.1 Industrial
- 5.2.2 Commercial (Retail & Office)
- 5.2.3 Residential
- 5.2.4 Construction & Demolition
- 5.2.5 Others(Institutional, Healthcare, Curb-side waste, etc.)
- 5.3 By Service Type
- 5.3.1 Collection, Transportation & Sorting
- 5.3.2 Disposal/ Treatment
- 5.3.2.1 Mechanical Recycling
- 5.3.2.2 Chemical / Advanced Recycling
- 5.3.2.3 Incineration with Energy Recovery
- 5.3.2.4 Controlled Landfilling
- 5.3.3 Others (Consulting, Audit & Training, etc.)
- 5.4 By End-Use Industry
- 5.4.1 Packaging
- 5.4.2 Construction
- 5.4.3 Automotive & E-Mobility
- 5.4.4 Electrical & Electronics
- 5.4.5 Textiles & Fashion
- 5.4.6 Healthcare
- 5.4.7 Others (Agriculture, Consumer Goods, etc.)
- 5.5 By Geography
- 5.5.1 North America
- 5.5.1.1 United States
- 5.5.1.2 Canada
- 5.5.1.3 Mexico
- 5.5.2 South America
- 5.5.2.1 Brazil
- 5.5.2.2 Argentina
- 5.5.2.3 Peru
- 5.5.2.4 Rest of South America
- 5.5.3 Europe
- 5.5.3.1 United Kingdom
- 5.5.3.2 Germany
- 5.5.3.3 France
- 5.5.3.4 Italy
- 5.5.3.5 Spain
- 5.5.3.6 BENELUX (Belgium, Netherlands, and Luxembourg)
- 5.5.3.7 NORDICS (Denmark, Finland, Iceland, Norway, and Sweden)
- 5.5.3.8 Rest of Europe
- 5.5.4 Asia-Pacific
- 5.5.4.1 China
- 5.5.4.2 India
- 5.5.4.3 Japan
- 5.5.4.4 Australia
- 5.5.4.5 South Korea
- 5.5.4.6 ASEAN (Indonesia, Thailand, Philippines, Malaysia, Vietnam)
- 5.5.4.7 Rest of Asia-Pacific
- 5.5.5 Middle East and Africa
- 5.5.5.1 Saudi Arabia
- 5.5.5.2 United Arab Emirates
- 5.5.5.3 Qatar
- 5.5.5.4 Kuwait
- 5.5.5.5 Turkey
- 5.5.5.6 Egypt
- 5.5.5.7 South Africa
- 5.5.5.8 Nigeria
- 5.5.5.9 Rest of Middle East and Africa
- 5.5.1 North America
6 Competitive Landscape
- 6.1 Market Concentration
- 6.2 Strategic Moves
- 6.3 Market Share Analysis
- 6.4 Company Profiles {(includes Global level Overview, Market level overview, Core Segments, Financials as available, Strategic Information, Products & Services, and Recent Developments)}
- 6.4.1 Veolia Environnement SA
- 6.4.2 SUEZ SA
- 6.4.3 Waste Management Inc.
- 6.4.4 Republic Services Inc.
- 6.4.5 Clean Harbors Inc.
- 6.4.6 Remondis SE & Co. KG
- 6.4.7 Biffa PLC
- 6.4.8 Stericycle Inc.
- 6.4.9 Covanta Holding Corp.
- 6.4.10 TOMRA Systems ASA
- 6.4.11 Plastic Energy Ltd.
- 6.4.12 Brightmark LLC
- 6.4.13 Agilyx Corporation
- 6.4.14 TerraCycle Inc.
- 6.4.15 Waste Connections Inc.
- 6.4.16 DS Smith PLC
- 6.4.17 Borealis AG
- 6.4.18 LyondellBasell Industries NV
- 6.4.19 Marius Pedersen A/S
7 Market Opportunities & Future Outlook
- 7.1 White-space & Unmet-Need Assessment

