PUBLISHER: Mordor Intelligence | PRODUCT CODE: 2044170

PUBLISHER: Mordor Intelligence | PRODUCT CODE: 2044170
Ammonium Nitrate - Market Share Analysis, Industry Trends & Statistics, Growth Forecasts (2026 - 2031)
The Ammonium Nitrate Market size is estimated at 53.43 Million tons in 2026, and is expected to reach 58.19 Million tons by 2031, at a CAGR of 4.36% during the forecast period (2026-2031).
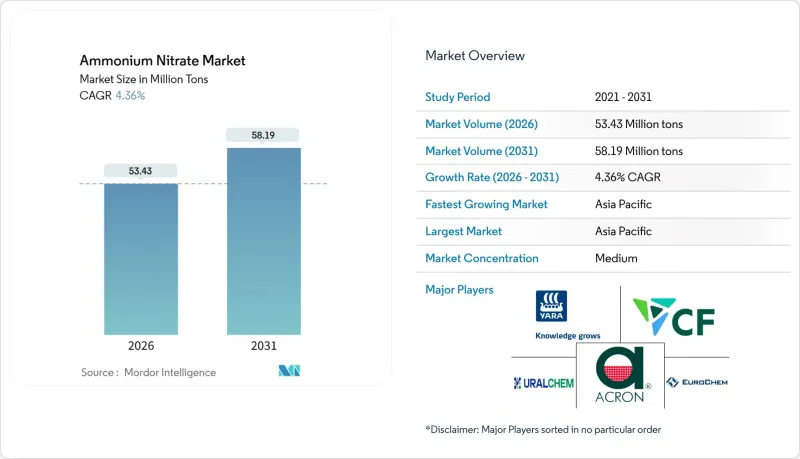
The ammonium nitrate market is responding to tighter carbon-border policies, localized explosive production near emerging copper and nickel hubs, and precision-agriculture adoption that favors coated granules with slower nutrient release. Mining operators are specifying higher-energy blends to unlock deeper ore bodies, while blue and green ammonia projects are reshaping the cost curve for downstream nitrates qualifying for embedded-carbon reporting. Incumbents such as Yara, CF Industries, and OCI are funneling capital into low-emission feedstock to defend their positions, as regional disruptors build smaller, flexible units that serve niche regenerative programs and defense channels. The ammonium nitrate market continues to balance growth in Asia-Pacific and South America against regulatory headwinds in North America and Europe.
Global Ammonium Nitrate Market Trends and Insights
Expansion of ANFO and Emulsion Explosives in Large-Scale Surface Mining
Surface coal, copper, and lithium operations are turning to higher-energy ANFO and emulsion blends that reduce drilling density and speed up overburden removal, increasing technical-grade ammonium nitrate consumption. Orica's 4D bulk-explosives platform combines emulsion with porous prills, offering variable energy output that tailors fragmentation and minimizes unit cost per ton of rock moved. Indonesia's nickel laterite projects and Chile's high-altitude copper pits require 20-30% more ammonium nitrate per ton of ore than older ANFO mixes because water ingress undermines conventional fuel-oil blends. Saudi Arabia's SCCL plans a 300,000 ton-per-year technical-grade plant at Ras Al Khair, demonstrating how Gulf producers intend to localize explosive inputs and serve African mining ventures. As mines chase higher recovery rates, the ammonium nitrate market benefits from a demand profile that is less price-sensitive than agriculture.
Increasing Demand for Fertilizers in Global Agriculture
Baseline nitrogen demand rises as populations grow, yet regional divergence persists: India's subsidy regime still favors urea, while Brazil's Cerrado growers move to calcium-ammonium-nitrate to counter soil acidification. The European Union's Farm to Fork strategy promotes precision technologies, pushing distributors toward polymer-coated granular ammonium nitrate that cuts leaching losses. Argentina's wheat producers lifted ammonium nitrate purchases 8% in 2025 on currency tailwinds, proving that price swings can override crop-nutrient traditions. The ammonium nitrate market, therefore, hinges on subsidy structures, carbon labeling, and agronomic differentiation rather than bulk nitrogen cost alone. Suppliers that bundle advisory services with coated or CAN products gain pricing power in this uneven policy landscape.
Stringent Regulations on Storage and Transport of Ammonium Nitrate
Following safety reviews, the US Bureau of Alcohol, Tobacco, Firearms, and Explosives shortened storage thresholds, compelling many rural distributors to drop ammonium nitrate inventories and pivot to UAN. Canada's Explosives Regulations impose locked magazines and setback distances that hinder on-farm storage, driving growers toward liquid solutions delivered in bulk. Australia's state zoning rules ban new depots within 500 meters of residences, shrinking distribution in peri-urban belts. While Asia maintains lighter oversight, the added compliance cost in OECD regions diverts 5-10% of nitrogen demand to substitutes. The ammonium nitrate market must therefore navigate uneven regulatory terrain that erodes its broad-acre fertilizer appeal.
Other drivers and restraints analyzed in the detailed report include:
- Decarbonised-Ammonia Projects Spurring Low-Carbon Nitrate Adoption
- Surge in Calcium-Ammonium-Nitrate Demand from Regenerative Farming Programs
- Availability of Substitute Nitrogen Fertilizers (Urea, UAN, Urea + NBPT)
For complete list of drivers and restraints, kindly check the Table Of Contents.
Segment Analysis
Explosives expand at a 4.91% CAGR, nearly a full point above the overall ammonium nitrate market, while fertilizers grow more slowly due to urea substitution. Copper and nickel mines in Chile, Peru, and Indonesia use emulsion blends that require 25-35% more technical-grade nitrate per blast than conventional ANFO, driving premium demand for porous prills with consistent density.
Fertilizer demand remains dominant in tonnage but is bifurcating: Europe invests in polymer-coated granular nitrate that satisfies nutrient-efficiency mandates, whereas Asia leans on subsidized urea, relegating ammonium nitrate to specialty crops. Explosives, by contrast, remain less price-sensitive because blasting misfires quickly inflate mining costs, allowing suppliers to command USD 20-30 per ton premiums over agricultural-grade product.
Granular product is the fastest-growing form at 5.66% CAGR, although porous prills still held 60.25% of volume in 2025 as the feedstock of choice for ANFO. Precision spreaders require uniform particle size, and polymer-coated granules extend nutrient release across 60-90 days, aligning with Europe's Farm to Fork goals.
Porous prills maintain dominance in explosives thanks to their ability to absorb fuel oil rapidly, ensuring stable detonation velocity in bulk systems. Integrated producers such as Grupa Azoty hedge bets by manufacturing both forms in the same complex, balancing mining exports with coated fertilizer sales in Central Europe.
The Ammonium Nitrate Market Report is Segmented by Application (Fertilizers, Explosives, and Other), Form (Porous Prills, Granular, and Liquid Solution/Suspension), Grade (Agricultural and Industrial), End-User Industry (Agriculture, Mining, Defense, and Other End-User Industries), and Geography (Asia-Pacific, North America, Europe, South America, and Middle East and Africa). Market Forecasts are Provided in Terms of Volume (tons).
Geography Analysis
Asia-Pacific led the global volume with 45.46% in 2025 and is advancing at a 5.01% CAGR, propelled by China's technical-grade exports to African and Latin American mines and India's gradual shift from urea dependence toward differentiated nitrates. China's coal-based ammonia remains cost-competitive, yet exporters increasingly upgrade to porous prills to capture mining premiums, reinforcing the ammonium nitrate market's supply pivot toward explosives.
North America held a substantial market volume, but ATF rules curtail on-farm storage, pushing distributors toward bulk UAN even as blue-ammonia projects come online to satisfy CBAM-linked buyers in Europe. Canada's potash and oil-sands industries sustain regional technical-grade demand that bypasses agricultural headwinds.
Europe grapples with CBAM reporting that penalizes high-emission imports, steering buyers toward domestic low-carbon supply such as Grupa Azoty's Tarnow plant and Yara's green-ammonia programs. Southern producers rely on North African imports, while Northern regions invest in carbon-capture retrofits to defend market share.
South America's market volume is driven by Brazil's soybean expansion and Chile's copper mining, yet the region lacks integrated capacity and imports porous prills from the Middle East and China, exposing it to freight volatility.
In the Middle East and Africa, Gulf blue-ammonia projects such as QAFCO 7 add 1.2 million tons of low-emission feedstock in 2026, positioning the region as a compliance hedge for European buyers. Saudi Arabia's forthcoming technical-grade unit and South Africa's mining uptake round out a diversified demand base.
- Abu Qir Fertilizers and Chemical Industries Company
- Acron
- Austin Powder
- Casale SA
- CF Industries Holdings, Inc.
- Dyno Nobel
- ENAEX
- EuroChem Group
- Fertiberia
- Grupa Azoty
- Hanwha Group
- MAXAMCORP HOLDING, SL
- Neochim Plc
- OCI
- Orica Limited
- OSTCHEM
- PJSC KuibyshevAzot
- Qatar Fertiliser Company (Q.P.S.C)
- San Corporation
- Sasol
- URALCHEM JSC
- Yara
Additional Benefits:
- The market estimate (ME) sheet in Excel format
- 3 months of analyst support
TABLE OF CONTENTS
1 Introduction
- 1.1 Study Assumptions and Market Definition
- 1.2 Scope of the Study
2 Research Methodology
3 Executive Summary
4 Market Landscape
- 4.1 Market Overview
- 4.2 Market Drivers
- 4.2.1 Surge in calcium-ammonium-nitrate demand from regenerative farming programs
- 4.2.2 Expansion of ANFO and emulsion explosives in large-scale surface mining
- 4.2.3 Rising controlled-blasting activity for shale-oil pipeline retrofits
- 4.2.4 Increasing demand for fertilizers in global agriculture
- 4.2.5 Decarbonised-ammonia projects spurring low-carbon nitrate adoption
- 4.3 Market Restraints
- 4.3.1 Stringent regulations on storage and transport of ammonium nitrate
- 4.3.2 Availability of substitute nitrogen fertilizers (urea, UAN, urea + NBPT)
- 4.3.3 Carbon-border-adjustment costs on high-emission ammonium nitrate
- 4.4 Value Chain Analysis
- 4.5 Porter's Five Forces
- 4.5.1 Bargaining Power of Suppliers
- 4.5.2 Bargaining Power of Buyers
- 4.5.3 Threat of New Entrants
- 4.5.4 Threat of Substitutes
- 4.5.5 Degree of Competition
5 Market Size and Growth Forecasts (Value and Volume)
- 5.1 By Application
- 5.1.1 Fertilizers
- 5.1.2 Explosives
- 5.1.3 Other Application (Gas Generators, Cold Packs, Pyrotechnics, Rocket Propulsion, and Industrial Processes)
- 5.2 By Form
- 5.2.1 Porous Prills
- 5.2.2 Granular
- 5.2.3 Liquid Solution / Suspension
- 5.3 By Grade
- 5.3.1 Agricultural Grade
- 5.3.2 Industrial Grade
- 5.4 By End-user Industry
- 5.4.1 Agriculture
- 5.4.2 Mining
- 5.4.3 Defense
- 5.4.4 Other End-user Industries (Automotive, Food Industry, Oil and Gas, Medical, and Construction)
- 5.5 By Geography
- 5.5.1 Asia-Pacific
- 5.5.1.1 China
- 5.5.1.2 India
- 5.5.1.3 Japan
- 5.5.1.4 South Korea
- 5.5.1.5 ASEAN Countries
- 5.5.1.6 Rest of Asia-Pacific
- 5.5.2 North America
- 5.5.2.1 United States
- 5.5.2.2 Canada
- 5.5.2.3 Mexico
- 5.5.3 Europe
- 5.5.3.1 Germany
- 5.5.3.2 United Kingdom
- 5.5.3.3 France
- 5.5.3.4 Italy
- 5.5.3.5 Spain
- 5.5.3.6 Nordic Countries
- 5.5.3.7 Rest of Europe
- 5.5.4 South America
- 5.5.4.1 Brazil
- 5.5.4.2 Argentina
- 5.5.4.3 Rest of South America
- 5.5.5 Middle East and Africa
- 5.5.5.1 Saudi Arabia
- 5.5.5.2 South Africa
- 5.5.5.3 Rest of Middle East and Africa
- 5.5.1 Asia-Pacific
6 Competitive Landscape
- 6.1 Market Concentration
- 6.2 Strategic Moves
- 6.3 Market Share(%)/Ranking Analysis
- 6.4 Company Profiles (includes Global level Overview, Market level overview, Core Segments, Financials as available, Strategic Information, Market Rank/Share for key companies, Products and Services, and Recent Developments)
- 6.4.1 Abu Qir Fertilizers and Chemical Industries Company
- 6.4.2 Acron
- 6.4.3 Austin Powder
- 6.4.4 Casale SA
- 6.4.5 CF Industries Holdings, Inc.
- 6.4.6 Dyno Nobel
- 6.4.7 ENAEX
- 6.4.8 EuroChem Group
- 6.4.9 Fertiberia
- 6.4.10 Grupa Azoty
- 6.4.11 Hanwha Group
- 6.4.12 MAXAMCORP HOLDING, SL
- 6.4.13 Neochim Plc
- 6.4.14 OCI
- 6.4.15 Orica Limited
- 6.4.16 OSTCHEM
- 6.4.17 PJSC KuibyshevAzot
- 6.4.18 Qatar Fertiliser Company (Q.P.S.C)
- 6.4.19 San Corporation
- 6.4.20 Sasol
- 6.4.21 URALCHEM JSC
- 6.4.22 Yara
7 Market Opportunities and Future Outlook
- 7.1 White-space and Unmet-Need Assessment
- 7.2 Development of Smart Explosives

