PUBLISHER: Mordor Intelligence | PRODUCT CODE: 2044189

PUBLISHER: Mordor Intelligence | PRODUCT CODE: 2044189
Laser Sensor - Market Share Analysis, Industry Trends & Statistics, Growth Forecasts (2026 - 2031)
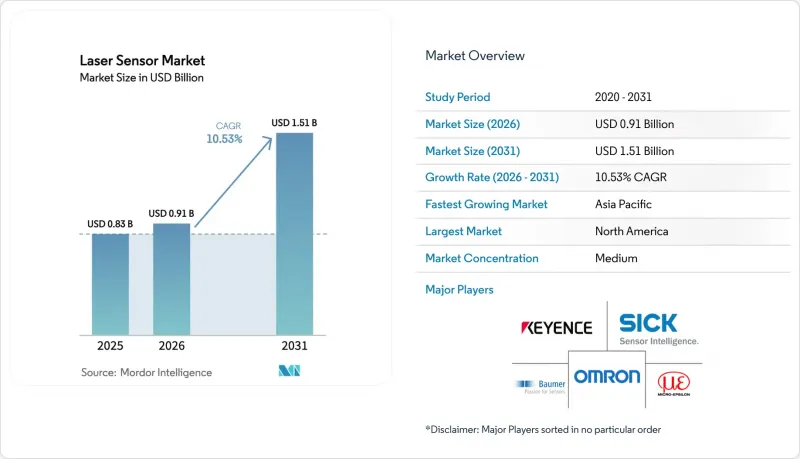
The laser sensor market size is expected to grow from USD 0.83 billion in 2025 to USD 0.91 billion in 2026 and is forecast to reach USD 1.51 billion by 2031 at a 10.53% CAGR over 2026-2031. Robust demand stems from precision-critical use cases where mechanical gauges risk contamination and vision systems cannot match the sub-micron repeatability offered by triangulation and time-of-flight devices. Electric-vehicle cell stacking, advanced semiconductor packaging, and warehouse automation are the three most influential adoption vectors, each exerting measurable pull on capital budgets as cycle-time and yield targets tighten. Hardware upgrades now routinely pair edge analytics with multi-axis laser displacement heads, curbing data latency while satisfying ISO 10360 and FDA 21 CFR Part 11 traceability mandates. Supply-side resilience is improving after indium-phosphide epitaxy shortages in 2025, yet vendors still hedge risk by qualifying gallium-nitride emitters for mid-power arrays.
Global Laser Sensor Market Trends and Insights
Precision-Gap Closure in EV Battery Assembly Accelerates Laser Displacement Sensor Uptake
Wider adoption of electric vehicles forced cell-to-pack assembly tolerances beneath the 50-micron threshold in 2025. Blue-violet confocal sensors now reach 0.5-micron repeatability, displacing mechanical gauges that risk foil damage. Tesla's Berlin plant cut rework by 12% after installing inline profilers, and Chinese lithium-ion giants cascading GB/T 36276 compliance have multiplied demand further. Vendors embed edge analytics to close feedback loops within 50 milliseconds, reducing server traffic by 70% and securing design wins across Europe and Asia. Subsidy programs in China, Germany, and the United States sustain momentum, keeping laser sensor market demand elevated.
Expansion of 3-D AOI in Semiconductor Packaging Spurs 3-D Line Sensor Demand
Chiplet, fan-out wafer-level, and hybrid bonding nodes call for co-planarity control within +-10 microns, a regime unachievable for 2-D AOI at economical takt times. Three-dimensional laser line sensors projecting structured light at 10 kHz now deliver 0.1-micron z-resolution in <200 milliseconds per substrate. TSMC deployed more than 300 units in 2025, citing an 8-point yield boost. Europe's Chips Act links subsidies to CpK above 1.67, effectively institutionalizing inline laser metrology, while Japan's METI has earmarked JPY 200 billion (USD 1.4 billion) for domestic toolsets. These mandates collectively accelerate laser sensor market penetration in packaging fabs.
Price Pressure from CMOS ToF Camera Alternatives
Depth-map cameras delivering 640X480 resolution at <USD 50 threaten laser distance sensors priced more than USD 80 in consumer robotics. ToF attach rates reached 68% of new vacuum robots in 2025. Suppliers counter by bundling on-sensor object-classification firmware, but price elasticity favors cameras in cost-driven segments. Industrial niches still shield lasers thanks to sunlight immunity and sub-millimeter accuracy, yet year-on-year entry-level ASP compression of 8-10% narrows this moat. The dynamic trims 0.8 points from the projected laser sensor market CAGR, especially in Asia-Pacific's appliance hubs.
Other drivers and restraints analyzed in the detailed report include:
- Migration from Ultrasonic to Laser Range Sensors in Smart Warehouses
- Falling Solid-State LiDAR Costs Enable ToF Sensors in European AGVs
- Regulatory Constraints on Class 3B and Class 4 Power Emissions
For complete list of drivers and restraints, kindly check the Table Of Contents.
Segment Analysis
Hardware represented 82.13% of the share in 2025, driven by one-off capital purchases of multi-axis profilers that each list between USD 60,000 and USD 120,000. A growing aftermarket for traceable calibration, predictive maintenance APIs, and sensor-fusion software now captures recurring budgets as factories tie metrology assets to MES platforms, pushing services to an 11.54% CAGR. Major vendors publicized double-digit service revenue lifts in 2026, confirming that contracts guaranteeing +-10-micron accuracy across aerospace jigs command premium pricing. Subscription layers typically run three to five years, embedding vendor lock-in while smoothing earnings volatility.
Software is the connective tissue; point-cloud libraries, SPC dashboards, and AI classifiers turn raw range data into actionable insights, lifting lifetime value well beyond hardware margin. Cognex's 2025 license, enabling interoperability with third-party lasers at USD 1,200 per seat, illustrates the trend. Meanwhile, emerging markets still allocate more capex to devices than to annual fees, sustaining hardware volume even as ASPs decline 6% each year for entry-level distance units. The combined dynamic positions services as the highest-growth pocket inside the broader laser sensor market.
Distance and range devices retained a 30.25% share in 2025, entrenched in fill-level, ground-clearance, and crane anti-collision tasks. Profiling and line sensors, however, are charting a CAGR of 11.71% through 2031 as parcel hubs, body-in-white lines, and tire plants intensify contour-mapping requirements. Amazon's roll-out of 8,000 profilers cut mis-sorts by 14% in one year, validating the switch. Displacement and triangulation sensors remain critical where sub-micron scrutiny outranks speed, such as wafer bump height checks.
Price erosion and CMOS camera creep siphon volume from basic distance segments, but industrial buyers stay loyal where lasers beat cameras on glare rejection, range, and motion blur immunity. Profilers also integrate natively with AI edge modules, awarding them an early mover edge in autonomous picking and dimensioning. This advantage keeps profiling at the vanguard of laser sensor market size gains across warehousing and automotive.
The Laser Sensor Market Report is Segmented by Component (Hardware, Software, and Services), Sensor Type (Distance/Range, Displacement, and More), Measurement Range (Less Than 100 Mm, and More), Power Output (Less Than 1 MW, 1-100 MW, and More), Dimensionality (1D Point, 2D Area, and 3D Profile), End-User Industry (Electronics, Automotive, and More), and Geography. The Market Forecasts are Provided in Terms of Value (USD).
Geography Analysis
North America held 39.82% of the share in 2025 thanks to electric-vehicle programs, aerospace quality charters, and USD 12 billion in U.S. warehouse-automation spend. FDA 21 CFR Part 11 bolsters traceable metrology in pharmaceuticals, while Canadian aerospace lines in Quebec and Ontario trimmed jig times by double digits after switching to laser trackers. Mexico's near-shoring boom added 18 million ft2 of plant floor in 2025, many with laser-guided welding cells to satisfy OEM tolerances.
Asia-Pacific is the fastest-growing region at a 12.01% CAGR because China, Japan, and South Korea inject subsidies into smart-factory retrofits and chip packaging lines. China's MIIT earmarked CNY 15 billion (USD 2.1 billion) for metrology upgrades, and Japan's JPY 200 billion (USD 1.4 billion) allotment for 3-D inspection tooling lowers entry barriers for domestic fabs. India's 45 million ft2 of new Grade-A warehouse space in 2025 banks on laser-equipped AMRs for 24-hour delivery promises, extending the laser sensor market's footprint across South Asia.
Europe grows more slowly as IEC 60825 and the Machinery Directive restrict high-power profiler deployment on open lines. Germany still accounts for 62% of regional demand, leveraging automotive and machine-tool sectors. France's ADEME grants of EUR 50 million (USD 54 million) speed LiDAR adoption in cold-chain sites, and the U.K. aerospace corridor captures savings from composite layup defect detection. The Middle East and Africa see early traction through Saudi Arabia's NEOM construction mega-project, while South America benefits from Brazilian automotive tool-ups despite macro volatility.
List of Companies Covered in this Report:
- Keyence Corporation
- SICK AG
- OMRON Corporation
- Micro-Epsilon Messtechnik GmbH and Co. KG
- IFM Electronic GmbH
- Baumer Electric AG
- SmartRay GmbH
- Rockwell Automation Inc.
- Dimetix AG
- First Sensor AG (TE Connectivity)
- Banner Engineering Corp.
- Panasonic Industry Co.
- Cognex Corporation
- FARO Technologies Inc.
- Honeywell International Inc.
- Polytec GmbH
- OMS Corporation
- Teledyne DALSA
- Acuity Laser (Schmitt Measurement)
- Hokuyo Automatic Co. Ltd.
- Datalogic S.p.A.
- Lumentum Holdings Inc.
- Trimble Inc.
- Hexagon AB
Additional Benefits:
- The market estimate (ME) sheet in Excel format
- 3 months of analyst support
TABLE OF CONTENTS
1 INTRODUCTION
- 1.1 Study Assumptions and Market Definition
- 1.2 Scope of the Study
2 RESEARCH METHODOLOGY
3 EXECUTIVE SUMMARY
4 MARKET LANDSCAPE
- 4.1 Market Overview
- 4.2 Market Drivers
- 4.2.1 Precision-Gap Closure in EV Battery Assembly Accelerates Laser Displacement Sensor Uptake
- 4.2.2 Expansion of 3D AOI in Semiconductor Packaging Spurs 3D Line Sensor Demand
- 4.2.3 Migration from Ultrasonic to Laser Range Sensors in Smart Warehouses
- 4.2.4 Falling Solid-State LiDAR Costs Enable ToF Sensors in European AGVs
- 4.2.5 Photonics-Integrated Displacement Sensors for Flexible OLED Inspection
- 4.2.6 Quantum-Cascade Laser Metrology in Additive Manufacturing
- 4.3 Market Restraints
- 4.3.1 Price Pressure from CMOS ToF Camera Alternatives
- 4.3.2 Regulatory Constraints on Class 3B and 4 Power Emissions
- 4.3.3 Limited InP Epitaxy Capacity for High-Power VCSEL Arrays
- 4.3.4 Edge-Compute Thermal Load Limits Sensor Fusion in Autonomous Drones
- 4.4 Impact of Macroeconomic Factors on the Market
- 4.5 Industry Supply-Chain Analysis
- 4.6 Technological Outlook
- 4.7 Regulatory Landscape
- 4.8 Porter's Five Forces Analysis
- 4.8.1 Threat of New Entrants
- 4.8.2 Bargaining Power of Buyers
- 4.8.3 Bargaining Power of Suppliers
- 4.8.4 Threat of Substitutes
- 4.8.5 Intensity of Competitive Rivalry
5 MARKET SIZE AND GROWTH FORECASTS (VALUE)
- 5.1 By Component
- 5.1.1 Hardware
- 5.1.2 Software
- 5.1.3 Services
- 5.2 By Sensor Type
- 5.2.1 Distance / Range Sensors
- 5.2.2 Displacement Sensors
- 5.2.3 Profiling / Line Sensors
- 5.2.4 Vibration and Energy Sensors
- 5.2.5 Triangulation Sensors
- 5.2.6 Other Sensor Types
- 5.3 By Measurement Range
- 5.3.1 Less than 100 mm (Short-Range)
- 5.3.2 100-300 mm (Medium-Range)
- 5.3.3 Greater than 300 mm (Long-Range)
- 5.4 By Power Output
- 5.4.1 Less than 1 MW
- 5.4.2 1-100 MW
- 5.4.3 101-500 MW
- 5.4.4 Greater than 500 MW
- 5.5 By Dimensionality
- 5.5.1 1D Point Sensors
- 5.5.2 2D Area Sensors
- 5.5.3 3D Profile Sensors
- 5.6 By End-user Industry
- 5.6.1 Electronics Manufacturing
- 5.6.2 Automotive and Mobility
- 5.6.3 Aerospace and Aviation
- 5.6.4 Building and Construction
- 5.6.5 Healthcare and Medical Devices
- 5.6.6 Food and Beverage Processing
- 5.6.7 Logistics, Warehousing and Robotics
- 5.6.8 Other End-user Industries
- 5.7 By Geography
- 5.7.1 North America
- 5.7.1.1 United States
- 5.7.1.2 Canada
- 5.7.1.3 Mexico
- 5.7.2 South America
- 5.7.2.1 Brazil
- 5.7.2.2 Argentina
- 5.7.2.3 Rest of South America
- 5.7.3 Europe
- 5.7.3.1 Germany
- 5.7.3.2 United Kingdom
- 5.7.3.3 France
- 5.7.3.4 Italy
- 5.7.3.5 Rest of Europe
- 5.7.4 Asia-Pacific
- 5.7.4.1 China
- 5.7.4.2 Japan
- 5.7.4.3 South Korea
- 5.7.4.4 Australia
- 5.7.4.5 India
- 5.7.4.6 Rest of Asia-Pacific
- 5.7.5 Middle East and Africa
- 5.7.5.1 Middle East
- 5.7.5.1.1 Saudi Arabia
- 5.7.5.1.2 United Arab Emirates
- 5.7.5.1.3 Turkey
- 5.7.5.1.4 Rest of Middle East
- 5.7.5.2 Africa
- 5.7.5.2.1 South Africa
- 5.7.5.2.2 Egypt
- 5.7.5.2.3 Rest of Africa
- 5.7.5.1 Middle East
- 5.7.1 North America
6 COMPETITIVE LANDSCAPE
- 6.1 Market Concentration
- 6.2 Strategic Moves
- 6.3 Market Share Analysis
- 6.4 Company Profiles (Includes Global Level Overview, Market Level Overview, Core Segments, Financials as Available, Strategic Information, Market Rank/Share, Products and Services, and Recent Developments)
- 6.4.1 Keyence Corporation
- 6.4.2 SICK AG
- 6.4.3 OMRON Corporation
- 6.4.4 Micro-Epsilon Messtechnik GmbH and Co. KG
- 6.4.5 IFM Electronic GmbH
- 6.4.6 Baumer Electric AG
- 6.4.7 SmartRay GmbH
- 6.4.8 Rockwell Automation Inc.
- 6.4.9 Dimetix AG
- 6.4.10 First Sensor AG (TE Connectivity)
- 6.4.11 Banner Engineering Corp.
- 6.4.12 Panasonic Industry Co.
- 6.4.13 Cognex Corporation
- 6.4.14 FARO Technologies Inc.
- 6.4.15 Honeywell International Inc.
- 6.4.16 Polytec GmbH
- 6.4.17 OMS Corporation
- 6.4.18 Teledyne DALSA
- 6.4.19 Acuity Laser (Schmitt Measurement)
- 6.4.20 Hokuyo Automatic Co. Ltd.
- 6.4.21 Datalogic S.p.A.
- 6.4.22 Lumentum Holdings Inc.
- 6.4.23 Trimble Inc.
- 6.4.24 Hexagon AB
7 MARKET OPPORTUNITIES AND FUTURE OUTLOOK
- 7.1 White-space and Unmet-Need Assessment

