PUBLISHER: Mordor Intelligence | PRODUCT CODE: 2044236

PUBLISHER: Mordor Intelligence | PRODUCT CODE: 2044236
North America Seafood - Market Share Analysis, Industry Trends & Statistics, Growth Forecasts (2026 - 2031)
The North America seafood market size is projected to expand from USD 36.64 billion in 2025 and USD 37.17 billion in 2026 to USD 39.95 billion by 2031, registering a CAGR of 1.45% between 2026 to 2031.
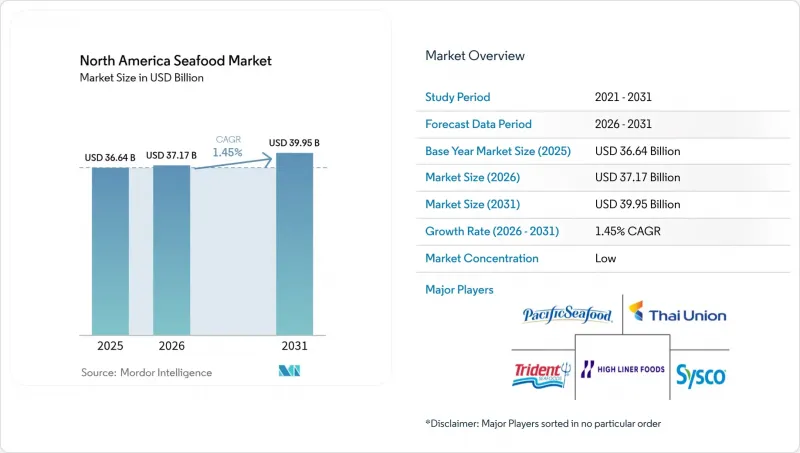
Demand for protein-dense diets, steady innovation in recirculating aquaculture systems, and retailer mandates for certified sourcing are the principal growth levers that keep the North America seafood market on a positive, if measured, trajectory. Shrimp imports, land-based salmon farming, and ready-to-eat product launches are expanding addressable consumption occasions, while blockchain traceability projects by leading processors enhance consumer trust. At the same time, the market faces offsetting pressures in the form of quota caps on overfished stocks, recurring food-safety recalls, and cost hurdles associated with sustainability certifications. Competitive intensity remains moderate because the top five suppliers collectively control only about 35% of regional revenue, leaving scope for regional fishermen, specialty labels, and start-ups to penetrate the North America seafood market with differentiated offerings.
North America Seafood Market Trends and Insights
Increasing Consumer Demand for Protein-Rich Foods
In 2024, per-capita seafood consumption in the United States rose to 20.5 pounds, up from 19.1 pounds in 2023. This increase is driven by health-conscious consumers replacing red meat with omega-3-rich fish and shellfish. The updated Dietary Guidelines for Americans, which recommend two servings of seafood per week, have further accelerated this trend, providing a structural boost to both fresh and frozen seafood categories. Similarly, Canada is experiencing a comparable shift, with Health Canada's 2025 Food Guide emphasizing lean proteins such as salmon and shrimp to address rising obesity rates. Millennials and Gen Z are at the forefront of this protein shift, viewing seafood as a "clean label" option free from the antibiotics commonly associated with poultry farming. In 2024, shrimp imports into the United States reached 1.5 billion pounds, with Ecuador supplying 38% of the total volume. Ecuador's dominance is attributed to its competitive pricing and perceived quality advantages over Asian suppliers. The elasticity of demand suggests that even minor price reductions, enabled by improved aquaculture yields, could unlock additional consumption potential, particularly in inland states where seafood market penetration remains lower compared to coastal regions.
Expanding Seafood Trade Creates Significant Export Opportunities
In 2024, U.S. seafood exports reached a notable USD 6.8 billion, with Alaska pollock, salmon, and crab leading the way to destinations like Japan, South Korea, and the European Union. Meanwhile, Canada, with seafood exports totaling CAD 8.2 billion (equivalent to USD 6.1 billion), saw lobster shipments primarily heading to China and salmon to the U.S. However, these exports face volatility due to tariff uncertainties stemming from evolving trade agreements. Mexico's shrimp exports, amounting to USD 1.1 billion in 2024, saw a significant 85% directed towards U.S. markets. This success is largely attributed to the benefits of USMCA's duty-free access and shorter shipping times compared to Asian suppliers. The trade landscape reveals an imbalance: North America grapples with an USD 18 billion seafood deficit, importing a staggering 90% of its seafood consumption. Yet, it capitalizes on exporting high-value species, such as the Alaskan king crab, commanding premiums over 200% compared to their imported counterparts. This price disparity has spurred a surge in domestic aquaculture, especially for species like barramundi and yellowtail. U.S. RAS farms, emphasizing freshness and traceability, find themselves in a competitive edge against Asian imports. Furthermore, the U.S.-Mexico-Canada Agreement (USMCA) has played a pivotal role in regulatory alignment, notably streamlining phytosanitary inspections. This has resulted in a commendable 30% reduction in border clearance times for refrigerated shipments during the 2024-2025 period.
Overfishing Reduces Wild Fish Catches, Threatening Sustainability
NOAA's 2024 Status of Stocks report identified 24 overfished species, accounting for 6% of the 397 federally managed stocks, including Gulf of Mexico red snapper and Atlantic bluefin tuna. While this marks a decline from 26 in 2023, commercial quotas remain restricted. Federal mandates require 10-15 years to rebuild overfished stocks, with catch limits set 30-50% below historical levels, pushing processors toward imports or farmed alternatives. Alaska pollock, the largest U.S. fishery at 3.3 billion pounds in 2024, faces climate-driven challenges. Warming Bering Sea temperatures reduced juvenile recruitment by 18% in 2023-2024, leading to a 12% quota cut for 2025. Canada's Atlantic cod stocks, devastated by 1990s overfishing, remain at 15% of historical biomass despite three decades of moratoria, highlighting long-term revenue losses from unsustainable practices. Newfoundland's fishing communities, heavily reliant on the industry, saw a 40% employment drop between 1992 and 2024, shaping current management policies. Illegal, unreported, and unregulated (IUU) fishing, estimated at 15% of global catches, undermines quota systems. In 2024, U.S. Customs and Border Protection seized 2.1 million pounds of undeclared seafood, mainly shrimp and crab mislabeled by country of origin.
Other drivers and restraints analyzed in the detailed report include:
- Advancements in Technology and Farming Practices Transform the Industry
- Consumer Preferences Shift Towards Sustainability-Focused Products
- Food Safety and Contamination Risks Remain Critical Industry Challenges
For complete list of drivers and restraints, kindly check the Table Of Contents.
Segment Analysis
Fish continues to dominate the North American seafood market in 2025, holding a 49.31% share, primarily due to the popularity of salmon and tuna. Salmon is highly sought after for its health benefits, including being a rich source of protein and omega-3 fatty acids, while tuna is favored for its convenience, long shelf life, and versatility in meal preparation. These qualities make both species staples in grocery stores and restaurants. Retailers often emphasize their nutritional value to attract health-conscious consumers. The growing demand for premium and sustainably sourced seafood further strengthens the fish segment.
Shrimp is expected to be the fastest-growing seafood segment in North America, with a projected CAGR of 1.98% through 2031. This growth is supported by advancements in indoor aquaculture systems, which enable consistent, year-round production while minimizing environmental impact. The introduction of value-added shrimp products, such as pre-seasoned, ready-to-cook options and meal kits, is making shrimp more appealing for quick and easy meals. These products align with the increasing consumer preference for convenience without sacrificing quality. Shrimp's adaptability to various cuisines, from Asian dishes to Western salads, further boosts its demand across retail and foodservice channels.
Canned seafood continues to dominate the North American seafood market, holding a 63.98% share in 2025. This segment remains popular due to its affordability, long shelf life, and convenience, making it a go-to option for many households. Products like tuna, salmon, and sardines are particularly favored, supported by strong brand trust and consistent quality. Recent innovations, such as flavored varieties, sustainably sourced options, and multipack offerings, have further boosted consumer interest. Retailers are capitalizing on these trends, using canned seafood's accessibility and versatility to drive sales and maintain its strong market position.
Processed seafood is the fastest-growing segment in the market, with a projected CAGR of 2.31% through 2031. This growth is largely driven by increasing demand for convenient, ready-to-eat options that cater to busy lifestyles. Products such as microwaveable seafood bowls, snack kits, and pre-cooked meals are gaining popularity among consumers seeking quick and easy meal solutions. Additionally, innovations in packaging and diverse recipe offerings are helping expand the appeal of processed seafood beyond traditional meal occasions. These factors position processed seafood as a key growth area in the North American seafood market, appealing to a wide range of consumer preferences.
The North America Seafood Market Report is Segmented by Seafood Type (Fish, Shrimp, Other Seafood), Form (Canned, Fresh/Chilled, Frozen, Processed), Source (Farmed, Wild-Caught), Distribution Channel (Off-Trade, On-Trade), and Geography (United States, Canada, Mexico, Rest of North America). Market Forecasts are Provided in Terms of Value (USD) and Volume (Units).
List of Companies Covered in this Report:
- Mazzetta Company, LLC
- Aqua Star Corp
- Tropic Seafood
- American Seafoods Group
- Mowi ASA
- Clearwater Seafoods
- Maruha Nichiro Corp. (Umios Corp.)
- Pacific American Fish Company (PAFCO)
- Beaver Street Fisheries
- Trident Seafoods Corp.
- Leroy Seafood Group
- Pacific Seafood Group
- The Bumble Bee Seafood Company
- Thai Union (Chicken of the Sea)
- NaturalShrimp Inc.
- Dulcich Inc.
- Dongwon Industries
- Sysco Corporation
- Cooke Inc.
- High Liner Foods Inc.
Additional Benefits:
- The market estimate (ME) sheet in Excel format
- 3 months of analyst support
TABLE OF CONTENTS
1 INTRODUCTION
- 1.1 Study Assumptions and Market Definition
- 1.2 Scope of the Study
2 RESEARCH METHODOLOGY
3 EXECUTIVE SUMMARY
4 MARKET LANDSCAPE
- 4.1 Market Overview
- 4.2 Market Drivers
- 4.2.1 Increasing consumer demand for protein-rich foods is driving market growth
- 4.2.2 Advancements in technology and farming practices are transforming the industry
- 4.2.3 The expanding seafood trade is creating significant export opportunities
- 4.2.4 Consumer preferences are shifting towards sustainability-focused products
- 4.2.5 Diverse culinary trends are fueling growth in the foodservice sector
- 4.2.6 Preference for premium and specialty seafood
- 4.3 Market Restraints
- 4.3.1 Overfishing reduces wild fish catches, threatening sustainability
- 4.3.2 Food safety and contamination risks remain critical industry challenges
- 4.3.3 Reliance on imports and trade barriers heighten supply chain vulnerabilities
- 4.3.4 Alternative proteins intensify market competition
- 4.4 Regulatory Outlook
- 4.5 Consumer Behaviour Analysis
- 4.6 Porter's Five Forces
- 4.6.1 Threat of New Entrants
- 4.6.2 Bargaining Power of Buyers
- 4.6.3 Bargaining Power of Suppliers
- 4.6.4 Threat of Substitute Products
- 4.6.5 Intensity of Competitive Rivalry
5 MARKET SIZE AND GROWTH FORECASTS (VALUE AND VOLUME)
- 5.1 By Seafood Type
- 5.1.1 Fish
- 5.1.1.1 Salmon
- 5.1.1.2 Tuna
- 5.1.1.3 Other Fish Type
- 5.1.2 Shrimp
- 5.1.3 Other Seafood
- 5.1.1 Fish
- 5.2 By Form
- 5.2.1 Canned
- 5.2.2 Fresh/Chilled
- 5.2.3 Frozen
- 5.2.4 Processed
- 5.3 By Source
- 5.3.1 Farmed
- 5.3.2 Wild-Caught
- 5.4 By Distribution Channel
- 5.4.1 Off-Trade
- 5.4.1.1 Supermarkets/Hypermarkets
- 5.4.1.2 Online Retail Stores
- 5.4.1.3 Convenience Stores
- 5.4.1.4 Others
- 5.4.2 On-Trade
- 5.4.2.1 Hotels
- 5.4.2.2 Restaurants
- 5.4.2.3 Catering
- 5.4.1 Off-Trade
- 5.5 By Geography
- 5.5.1 United States
- 5.5.2 Canada
- 5.5.3 Mexico
- 5.5.4 Rest of North America
6 COMPETITIVE LANDSCAPE
- 6.1 Market Concentration
- 6.2 Strategic Moves
- 6.3 Market Share Analysis
- 6.4 Company Profiles (includes Global-level Overview, Market-level Overview, Core Segments, Financials (if available), Strategic Information, Market Rank/Share, Products and Services, Recent Developments)
- 6.4.1 Mazzetta Company, LLC
- 6.4.2 Aqua Star Corp
- 6.4.3 Tropic Seafood
- 6.4.4 American Seafoods Group
- 6.4.5 Mowi ASA
- 6.4.6 Clearwater Seafoods
- 6.4.7 Maruha Nichiro Corp. (Umios Corp.)
- 6.4.8 Pacific American Fish Company (PAFCO)
- 6.4.9 Beaver Street Fisheries
- 6.4.10 Trident Seafoods Corp.
- 6.4.11 Leroy Seafood Group
- 6.4.12 Pacific Seafood Group
- 6.4.13 The Bumble Bee Seafood Company
- 6.4.14 Thai Union (Chicken of the Sea)
- 6.4.15 NaturalShrimp Inc.
- 6.4.16 Dulcich Inc.
- 6.4.17 Dongwon Industries
- 6.4.18 Sysco Corporation
- 6.4.19 Cooke Inc.
- 6.4.20 High Liner Foods Inc.
7 MARKET OPPORTUNITIES AND FUTURE OUTLOOK

