PUBLISHER: Mordor Intelligence | PRODUCT CODE: 2044247

PUBLISHER: Mordor Intelligence | PRODUCT CODE: 2044247
NFT Gaming - Market Share Analysis, Industry Trends & Statistics, Growth Forecasts (2026 - 2031)
The NFT gaming market size is projected to expand from USD 0.53 trillion in 2025 and USD 0.62 trillion in 2026 to USD 1.21 trillion by 2031, registering a 14.31% CAGR between 2026 and 2031.
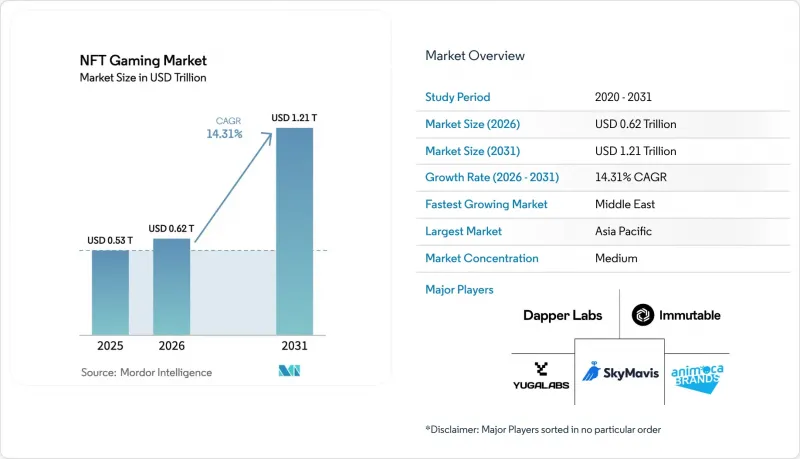
The rapid growth flows from lower blockchain transaction costs, expanding venture funding, and the shift toward shared publisher-player economics. Layer-2 scaling now supports micro-payments that keep game economies fluid, while the steady rollout of metaverse worlds broadens the addressable audience. Institutional investors are backing studios that can deliver AAA-quality play, cementing confidence that the NFT gaming market is entering a production-grade era. Finally, regional policy clarity in Asia-Pacific and the Middle East is shortening time-to-launch for studios that previously waited on licensing guidance.
Global NFT Gaming Market Trends and Insights
Shift To Distributed Publisher-Player Value Capture
Smart-contract splits now route 10%-30% of secondary-market proceeds back to the players who minted or earned the assets, replacing the one-way revenue flow of traditional free-to-play. Axie Infinity users earned USD 1.3 billion from resale royalties in 2025, a figure that still held even after a 22% price correction. Wemade's Wemix 3.0 titles boosted monthly active users to 4.2 million by adopting a player-favoured 70-30 payout. The design philosophy puts retention ahead of upfront monetization because players own the upside. Policymakers have yet to define whether these flows qualify as investment income, creating a temporary gray zone inside the European Union. Even so, the mechanism answers long-standing calls for fairer value distribution and is likely to become standard as publishing houses chase higher engagement scores.
Metaverse Alignment Accelerating Uptake
Persistent virtual worlds such as Decentraland and The Sandbox logged 18 million unique wallet connections in 2025, a 34% rise over 2024. Brand tenants like Adidas and Coca-Cola lease digital real estate, giving NFTs utility that lasts outside a single title. Yuga Labs moved USD 420 million in land sales during the March 2025 Otherside mint, showing the purchasing power of cross-IP collectors. The convergence attracts casual spectators who discover gaming through branded events rather than gameplay trailers. Performance bottlenecks persist, evidenced by sub-20 fps rates during peak Decentraland events, but an Unreal Engine 5 migration scheduled for mid-2026 should lift capacity. As metaverse layers mature, they lock in demand for interoperable avatars, weapons, and real estate that travel with the user rather than the app.
Regulatory Uncertainty Over Digital Assets
The Securities and Exchange Commission pursued 14 enforcement actions against NFT games in 2025, extracting USD 340 million in settlements and forcing studios to strip investment language from marketing materials. By contrast, the European Union's MiCA framework offers a licensing path that balances AML checks with innovation. South Korea approved eight blockchain game operators under rules that mandate segregated wallets and insurance for player deposits, creating a compliance blueprint. Japan now requires NFT marketplaces to register as crypto-asset exchanges if they enable secondary trading, raising overhead for smaller teams. Regions with strict or ambiguous policies impose launch delays, inflating development costs and tempering the NFT gaming market's otherwise steep growth curve.
Other drivers and restraints analyzed in the detailed report include:
- Venture-Capital Funding Inflows to Blockchain Gaming
- Rising Play-To-Earn Monetization Preference
- Environmental Criticism of Proof-Of-Work Chains
For complete list of drivers and restraints, kindly check the Table Of Contents.
Segment Analysis
Mobile Gaming held a dominant 46.19% share of NFT gaming market size in 2025. Widespread smartphone ownership and wallet integrations inside iOS and Android streamline onboarding. Players gravitate to bite-sized sessions, yet titles such as Mirandus prove that high-fidelity streaming is viable without local crypto wallets. Lower acquisition costs, at USD 34 per install, keep marketing budgets efficient, although churn rates are higher than in PC segments.
Cloud Gaming is forecast to post the fastest 15.31% CAGR, powered by 5G rollouts that push latency under 20 milliseconds. Server-side wallet custody hides blockchain complexity from users, positioning cloud as a bridge for traditional gamers who value convenience. As console platforms hesitate to approve NFT games, cloud services fill the gap by offering cross-device play under a single subscription. Hardware requirements drop for end users, but developers must optimize smart contracts to minimize server costs, shaping a technical agenda that dominates roadmaps through 2031.
Role-Playing Games commanded 38.53% of NFT gaming market share in 2025. Narrative depth encourages players to buy and trade character NFTs, extending engagement cycles that average 47 minutes per session. Long story arcs support seasonal drops, letting publishers monetize without inflating token supply. The immersive format also lends itself to on-chain governance, where holders vote on quest outcomes, increasing community stickiness.
Simulation titles are expanding at a 15.84% CAGR as they tokenize real-world assets inside city builders and farm simulators. Passive income loops draw non-gamer demographics who approach the experience as a light economic sandbox. VulcanVerse players can stake land NFTs that yield resources, adding DeFi-like incentives within a familiar gameplay loop. Balancing advanced economies across thousands of micro-transactions stresses design teams, yet the upside is a scalable audience outside the core RPG fan base.
The NFT Gaming Market Report is Segmented by Platform (Mobile Gaming, PC Gaming, Console Gaming, and Cloud Gaming), Game Genre (Role-Playing Games, Strategy, Simulation, Sports, More Game Genres), Revenue Model (Play-To-Earn, Free-To-Play With NFT Micro-Transactions, and More), Blockchain (Ethereum, Binance Smart Chain, Polygon, and More), and Geography. The Market Forecasts are Provided in Terms of Value (USD).
Geography Analysis
Asia-Pacific held 41.74% of 2025 revenue, anchored by South Korea's clear licensing regime and Japan's open stance toward blockchain game operators. Studios launch first in these markets because approval timelines are predictable, letting marketing teams coordinate global rollouts. China's ban on secondary NFT trading forces modified "digital collectible" builds, yet Tencent still attracted 12 million users under the compliant Zhixin Chain model, illustrating that the NFT gaming market can adapt to heavy restrictions.
The Middle East is the fastest-growing region at a 15.43% CAGR through 2031. Sovereign funds placed more than USD 1 billion into Web3 gaming infrastructure during 2025, accelerating studio creation inside Saudi Arabia's NEOM and the UAE's Dubai Multi Commodities Centre. Animoca Brands opened an Abu Dhabi base and partnered with Mubadala, giving Arabic developers access to seasoned publishers.
North America delivered 28% of 2025 sales even as SEC actions shook early token launches. Epic Games' wallet toolkit inside Unreal Engine lowers technical barriers, encouraging traditional studios to experiment without building bespoke chains. Europe, at 19% share, benefits from MiCA, which gives studios a rules-based path to market. South America contributed 7% by leveraging stablecoins that hedge local inflation, while Africa's 4% share came from Nigeria and South Africa where high mobile penetration meets growing remittance use cases. Each territory presents unique regulatory or infrastructure hurdles, yet the global appetite for ownership-driven play remains consistent, supporting a broadly distributed growth story for the NFT gaming industry.
- Sky Mavis Pte Ltd
- Immutable Pty Ltd
- Yuga Labs Inc
- Animoca Brands Corporation Ltd
- Dapper Labs Inc
- Gala Games LLC
- Illuvium Labs Ltd
- Mythical Inc
- Wemade Co Ltd
- Netmarble Corporation
- Com2uS Holdings Corporation
- Decentraland Foundation
- Enjin Pte Ltd
- Sorare SAS
- Ubisoft Entertainment SA
- Electronic Arts Inc
- Epic Games Inc
- Splinterlands Inc
- Vulcan Forged Ltd
- Ozone Networks Inc (OpenSea)
Additional Benefits:
- The market estimate (ME) sheet in Excel format
- 3 months of analyst support
TABLE OF CONTENTS
1 INTRODUCTION
- 1.1 Study Assumptions and Market Definition
- 1.2 Scope of the Study
2 RESEARCH METHODOLOGY
3 EXECUTIVE SUMMARY
4 MARKET LANDSCAPE
- 4.1 Market Overview
- 4.2 Market Drivers
- 4.2.1 Shift to Distributed Publisher-Player Value Capture
- 4.2.2 Metaverse Alignment Accelerating Uptake
- 4.2.3 Venture-Capital Funding Inflows to Blockchain Gaming
- 4.2.4 Rising Play-to-Earn Monetization Preference
- 4.2.5 Layer-2 Scaling Slashing Transaction Costs
- 4.2.6 Interoperable NFT Standards Enabling Cross-Game Assets
- 4.3 Market Restraints
- 4.3.1 Regulatory Uncertainty Over Digital Assets
- 4.3.2 Environmental Criticism of Proof-of-Work Chains
- 4.3.3 Token Inflation Undermining In-Game Economies
- 4.3.4 On-Boarding Friction for Non-Crypto Gamers
- 4.4 NFT in Gaming, A Paradigm Shift
- 4.5 Adoption Trends Analysis
- 4.5.1 First-Generation NFT Titles
- 4.5.2 Second-Generation NFT plus P2E Titles
- 4.5.3 Third-Generation NFT plus P2E plus High-Fidelity Graphics
- 4.5.4 Fourth-Generation NFT plus P2E plus AAA Titles
- 4.6 Industry Value-Chain Analysis
- 4.7 Regulatory Landscape
- 4.8 Technological Outlook
- 4.9 Impact of Macroeconomic Factors
- 4.10 Porter's Five Forces Analysis
- 4.10.1 Threat of New Entrants
- 4.10.2 Bargaining Power of Buyers
- 4.10.3 Bargaining Power of Suppliers
- 4.10.4 Threat of Substitutes
- 4.10.5 Competitive Rivalry
- 4.11 Investment Analysis
5 MARKET SIZE AND GROWTH FORECASTS (VALUE)
- 5.1 By Platform
- 5.1.1 Mobile Gaming
- 5.1.2 PC Gaming
- 5.1.3 Console Gaming
- 5.1.4 Cloud Gaming
- 5.2 By Game Genre
- 5.2.1 Role-Playing Games (RPG)
- 5.2.2 Strategy
- 5.2.3 Simulation
- 5.2.4 Sports
- 5.2.5 Other Game Genres
- 5.3 By Revenue Model
- 5.3.1 Play-to-Earn (P2E)
- 5.3.2 Free-to-Play with NFT Micro-Transactions
- 5.3.3 Subscription plus NFT Perks
- 5.3.4 Hybrid Models
- 5.4 By Blockchain
- 5.4.1 Ethereum
- 5.4.2 Binance Smart Chain
- 5.4.3 Polygon
- 5.4.4 Other Blockchain Protocols
- 5.5 By Geography
- 5.5.1 North America
- 5.5.1.1 United States
- 5.5.1.2 Canada
- 5.5.1.3 Mexico
- 5.5.2 South America
- 5.5.2.1 Brazil
- 5.5.2.2 Argentina
- 5.5.2.3 Rest of South America
- 5.5.3 Europe
- 5.5.3.1 Germany
- 5.5.3.2 France
- 5.5.3.3 United Kingdom
- 5.5.3.4 Italy
- 5.5.3.5 Spain
- 5.5.3.6 Rest of Europe
- 5.5.4 Asia-Pacific
- 5.5.4.1 China
- 5.5.4.2 Japan
- 5.5.4.3 India
- 5.5.4.4 South Korea
- 5.5.4.5 Australia
- 5.5.4.6 Rest of Asia-Pacific
- 5.5.5 Middle East
- 5.5.5.1 Saudi Arabia
- 5.5.5.2 United Arab Emirates
- 5.5.5.3 Turkey
- 5.5.5.4 Rest of Middle East
- 5.5.6 Africa
- 5.5.6.1 South Africa
- 5.5.6.2 Egypt
- 5.5.6.3 Nigeria
- 5.5.6.4 Rest of Africa
- 5.5.1 North America
6 COMPETITIVE LANDSCAPE
- 6.1 Market Concentration
- 6.2 Strategic Moves
- 6.3 Market Share Analysis
- 6.4 Company Profiles (includes Global Level Overview, Market Level Overview, Core Segments, Financials as available, Strategic Information, Market Rank/Share, Products and Services, Recent Developments)
- 6.4.1 Sky Mavis Pte Ltd
- 6.4.2 Immutable Pty Ltd
- 6.4.3 Yuga Labs Inc
- 6.4.4 Animoca Brands Corporation Ltd
- 6.4.5 Dapper Labs Inc
- 6.4.6 Gala Games LLC
- 6.4.7 Illuvium Labs Ltd
- 6.4.8 Mythical Inc
- 6.4.9 Wemade Co Ltd
- 6.4.10 Netmarble Corporation
- 6.4.11 Com2uS Holdings Corporation
- 6.4.12 Decentraland Foundation
- 6.4.13 Enjin Pte Ltd
- 6.4.14 Sorare SAS
- 6.4.15 Ubisoft Entertainment SA
- 6.4.16 Electronic Arts Inc
- 6.4.17 Epic Games Inc
- 6.4.18 Splinterlands Inc
- 6.4.19 Vulcan Forged Ltd
- 6.4.20 Ozone Networks Inc (OpenSea)
7 MARKET OPPORTUNITIES AND FUTURE OUTLOOK
- 7.1 White-Space and Unmet-Need Assessment

