
PUBLISHER: Mordor Intelligence | PRODUCT CODE: 2061497

PUBLISHER: Mordor Intelligence | PRODUCT CODE: 2061497
Direct Drive Wind Turbine - Market Share Analysis, Industry Trends & Statistics, Growth Forecasts (2026 - 2031)
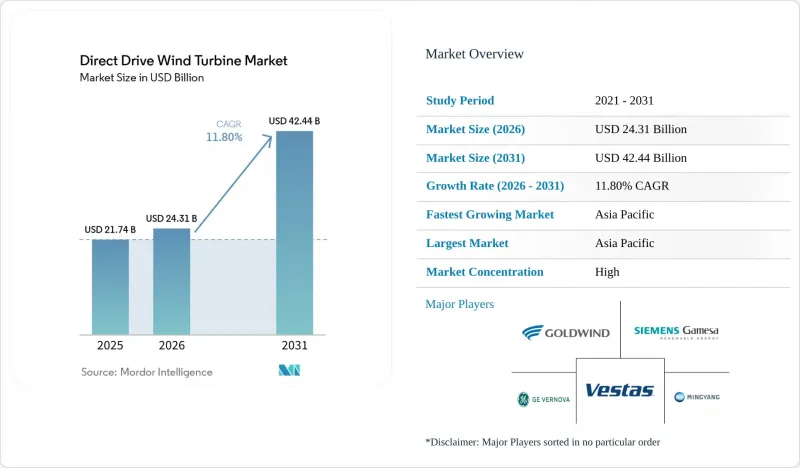
According to Mordor Intelligence, the direct drive wind turbine market size in 2026 is estimated at USD 24.31 billion, growing from 2025 value of USD 21.74 billion with 2031 projections showing USD 42.44 billion, growing at 11.80% CAGR over 2026-2031.
This report is Segmented by Power Rating (Up To 3 MW, 3 MW To 8 MW, and More), Generator Technology (Permanent-Magnet Synchronous and Electrically-Excited Synchronous), Installation Type (Onshore, Fixed-Bottom Offshore, and Floating Offshore), Application (Utility-Scale Wind Farms and Distributed), Geography (North America, Europe, Asia-Pacific, South America, and Middle East and Africa).
Global Direct Drive Wind Turbine Market Trends and Insights
Declining Levelized Cost of Electricity (LCOE) for >=4 MW Direct Drive Turbines
Wind LCOE averaged USD 0.033/kWh in 2024, a 70% fall since 2010, with gearbox-free designs removing major maintenance cost centers. Offshore projects gain the most because remote servicing of gearboxes is expensive and logistically complex. Larger nacelles lower cost per MW even as generator mass rises, reinforcing a virtuous cycle where scale reduces unit pricing. Floating platforms amplify these savings because simplified drivetrains cut service visits under harsh marine conditions. As utilities routinely specify turbines exceeding 4 MW, the direct-drive wind turbine market gains structural cost leadership.
Rapid Offshore Wind Build-Out Targets in EU, UK & China
EU legislation aims for 60 GW of offshore capacity by 2030 and 300 GW by 2050, while China and the UK have similarly ambitious roadmaps. Combined pipelines exceed 400 GW, incentivising OEMs to push direct drive ratings beyond 15 MW to maximise energy capture. Floating offshore prospects swell from 270 MW in 2024 to a 244 GW pipeline, expanding deep-water potential that favours gearbox-free systems. Clear policy visibility unlocks capital for new factories and multi-GW frame agreements.
Heavy Nacelle Mass Increases Logistics Costs for Onshore Sites
A 10 MW direct-drive generator weighs around 300 t, which significantly increases tower steel and transport costs; tower components already account for 26% of turbine costs. Route constraints mean up to 11 over-dimensioned truckloads per 2 MW turbine and crane hire that can add USD 100,000 per unit. OEMs pursue modular generators and onsite assembly, though these raise field-quality risks.
Other drivers and restraints analyzed in the detailed report include:
- Rising OEM Preference for Simplified Drivetrains (Gearbox-Free)
- Rare-Earth Magnet Recycling Breakthroughs Lowering NdFeB Input Cost
- Limited Global Rare-Earth Mining & Refining Capacity
For complete list of drivers and restraints, kindly check the Table Of Contents.
Segment Analysis
The direct drive wind turbine market size for the 3 MW-8 MW band was the highest in 2025, accounting for 43.25% of the revenue, driven by widespread onshore adoption where logistics remain manageable. Above 15 MW machines, however, promise the steepest upside with a 21.96% CAGR, leveraged by fixed-bottom and floating offshore projects that reward higher capacity factors.
Falling capital expenditure per installed megawatt motivates developers to order ever-larger turbines, while certification delays act as a gating factor. Vestas' V236-15.0 MW model alone secured 7 GW of firm commitments, illustrating early confidence in ultra-large nacelles. Yet transportation and crane capability in near-shore yards remain barriers for rapid volume scale-up.
Permanent-magnet synchronous units owned 87.90% of the direct drive wind turbine market in 2025, rising on a 12.45% CAGR through 2031 as efficiency and low maintenance trump magnet cost worries. Rotor winding losses are absent, enabling higher energy yield and easier compliance with evolving grid codes. Electrically excited machines occupy a shrinking niche, primarily used where magnet supply security outweighs energy efficiency.
Recycling advances and alternative compounds gradually lessen PMSG cost headwinds, potentially extending dominance. EESG vendors emphasise design flexibility and magnet-free supply chains, but added maintenance complexity and lower output limit uptake. Superconducting research could disrupt both camps long term, yet commercial traction appears unlikely before 2030.
Geography Analysis
Asia-Pacific recorded 48.90% of global revenue in 2025 and is projected to expand at a 12.62% CAGR through 2031. China's large-scale offshore roll-out and domestic supply chain integration underpin regional cost advantages of 20-30% over Western peers. Policy clarity supports factory investments, including Goldwind's new Brazilian plant that extends pricing leverage into Latin America.
Europe ranks second yet leads technology deployment in floating offshore and grid-forming applications. EU targets, along with local content mandates, drive new capacity announcements, such as the 1 GW Inch Cape project equipped with V236-15.0 MW turbines. OEM factory expansions in Poland, the UK, and Denmark highlight sustained demand.
North America gains momentum through the U.S. Inflation Reduction Act, spurring domestic component sourcing. GE Vernova's repower contracts, topping 1 GW, mirror the rising procurement of direct-drive nacelles made in-country. Meanwhile, Middle East sovereign funds and Latin American developers are turning to Chinese OEM partnerships to fast-track local capacity, thereby adding geographic diversity to future sales.
- Vestas Wind Systems A/S
- Goldwind Science & Technology Co. Ltd.
- Siemens Gamesa Renewable Energy S.A.
- GE Vernova (GE Renewable Energy)
- Envision Energy Ltd.
- Ming Yang Smart Energy Group Ltd.
- Enercon GmbH
- Hitachi Energy Ltd.
- Senvion India
- Lagerwey (Enercon DD platform)
- Toshiba Energy Systems & Solutions
- Hyundai Electric & Energy Systems
- Doosan Enerbility Co. Ltd.
- Shanghai Electric Wind Power Group
- Inox Wind Ltd.
- NSK Ltd. (main bearings)
- SKF AB (drivetrain bearings)
- Moog Inc. (pitch systems)
- Flender GmbH (Winergy converters)
Additional Benefits:
- The market estimate (ME) sheet in Excel format
- 3 months of analyst support
TABLE OF CONTENTS
1 Introduction
- 1.1 Study Assumptions & Market Definition
- 1.2 Scope of the Study
2 Research Methodology
3 Executive Summary
4 Market Landscape
- 4.1 Market Overview
- 4.2 Market Drivers
- 4.2.1 Declining Levelized Cost of Electricity (LCOE) for ?4 MW DD turbines
- 4.2.2 Rapid offshore wind build-out targets in EU, UK & China
- 4.2.3 Rising OEM preference for simplified drivetrains (gearbox-free)
- 4.2.4 Rare-earth magnet recycling breakthroughs lowering NdFeB input cost
- 4.2.5 Grid-forming inverter capability demand for high-penetration renewables
- 4.3 Market Restraints
- 4.3.1 Heavy nacelle mass increases logistics costs for onshore sites
- 4.3.2 Limited global rare-earth mining & refining capacity
- 4.3.3 Slow certification cycles for ≥15 MW next-gen DD prototypes
- 4.4 Supply-Chain Analysis
- 4.5 Regulatory Landscape
- 4.6 Technological Outlook
- 4.7 Porter's Five Forces
- 4.7.1 Bargaining Power of Suppliers
- 4.7.2 Bargaining Power of Buyers
- 4.7.3 Threat of New Entrants
- 4.7.4 Threat of Substitutes
- 4.7.5 Intensity of Competitive Rivalry
5 Market Size & Growth Forecasts
- 5.1 By Power Rating
- 5.1.1 Up to 3 MW
- 5.1.2 3 MW to 8 MW
- 5.1.3 8 MW to 15 MW
- 5.1.4 Above 15 MW
- 5.2 By Generator Technology
- 5.2.1 Permanent-Magnet Synchronous (PMSG)
- 5.2.2 Electrically-Excited Synchronous (EESG)
- 5.3 By Installation Type
- 5.3.1 Onshore
- 5.3.2 Fixed-bottom Offshore
- 5.3.3 Floating Offshore
- 5.4 By Application
- 5.4.1 Utility-Scale Wind Farms
- 5.4.2 Distributed (Below 5 MW)
- 5.5 By Geography
- 5.5.1 North America
- 5.5.1.1 United States
- 5.5.1.2 Canada
- 5.5.1.3 Mexico
- 5.5.2 Europe
- 5.5.2.1 Germany
- 5.5.2.2 United Kingdom
- 5.5.2.3 France
- 5.5.2.4 Spain
- 5.5.2.5 Sweden
- 5.5.2.6 Finland
- 5.5.2.7 Turkey
- 5.5.2.8 Rest of Europe
- 5.5.3 Asia Pacific
- 5.5.3.1 China
- 5.5.3.2 India
- 5.5.3.3 Japan
- 5.5.3.4 South Korea
- 5.5.3.5 Australia
- 5.5.3.6 Vietnam
- 5.5.3.7 Rest of Asia Pacific
- 5.5.4 South America
- 5.5.4.1 Brazil
- 5.5.4.2 Argentina
- 5.5.4.3 Chile
- 5.5.4.4 Rest of South America
- 5.5.5 Middle East and Africa
- 5.5.5.1 Saudi Arabia
- 5.5.5.2 Kenya
- 5.5.5.3 South Africa
- 5.5.5.4 Morocco
- 5.5.5.5 Rest of Middle East and Africa
- 5.5.1 North America
6 Competitive Landscape
- 6.1 Market Concentration
- 6.2 Strategic Moves (M&A, Partnerships, PPAs)
- 6.3 Market Share Analysis (Market Rank/Share for key companies)
- 6.4 Company Profiles (includes Global level Overview, Market level overview, Core Segments, Financials as available, Strategic Information, Products & Services, and Recent Developments)
- 6.4.1 Vestas Wind Systems A/S
- 6.4.2 Goldwind Science & Technology Co. Ltd.
- 6.4.3 Siemens Gamesa Renewable Energy S.A.
- 6.4.4 GE Vernova (GE Renewable Energy)
- 6.4.5 Envision Energy Ltd.
- 6.4.6 Ming Yang Smart Energy Group Ltd.
- 6.4.7 Enercon GmbH
- 6.4.8 Hitachi Energy Ltd.
- 6.4.9 Senvion India
- 6.4.10 Lagerwey (Enercon DD platform)
- 6.4.11 Toshiba Energy Systems & Solutions
- 6.4.12 Hyundai Electric & Energy Systems
- 6.4.13 Doosan Enerbility Co. Ltd.
- 6.4.14 Shanghai Electric Wind Power Group
- 6.4.15 Inox Wind Ltd.
- 6.4.16 NSK Ltd. (main bearings)
- 6.4.17 SKF AB (drivetrain bearings)
- 6.4.18 Moog Inc. (pitch systems)
- 6.4.19 Flender GmbH (Winergy converters)
7 Market Opportunities & Future Outlook
- 7.1 White-space & Unmet-Need Assessment

