
PUBLISHER: Mordor Intelligence | PRODUCT CODE: 2061523

PUBLISHER: Mordor Intelligence | PRODUCT CODE: 2061523
Flow Cytometry - Market Share Analysis, Industry Trends & Statistics, Growth Forecasts (2026 - 2031)
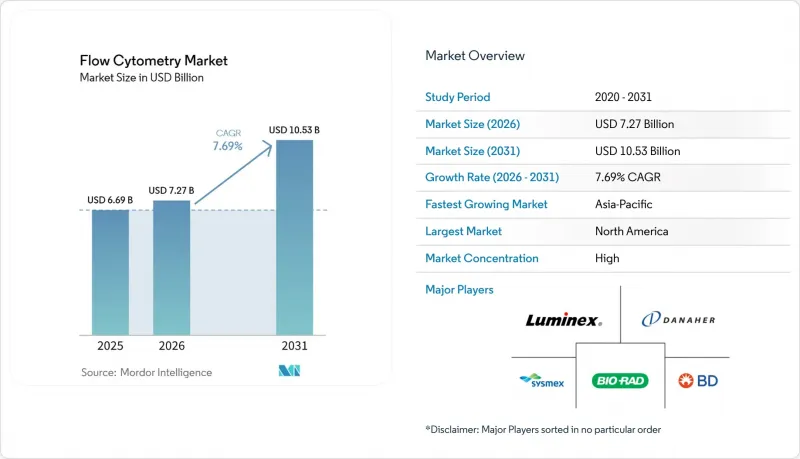
According to Mordor Intelligence, the flow cytometry market size is projected to be USD 6.69 billion in 2025, USD 7.27 billion in 2026, and reach USD 10.53 billion by 2031, growing at a CAGR of 7.69% from 2026 to 2031.
This report is Segmented by Product and Services (Instruments [Cell Analyzers and Cell Sorters], Reagents & Consumables, Software, and Services), Technology (Cell-Based Flow Cytometry, and More ), Application (Clinical Diagnostics, Drug Discovery & Development, and More), End-User (Hospitals & Clinics, and More), and Geography (North America, and More). The Market Forecasts are Provided in Terms of Value (USD).
Global Flow Cytometry Market Trends and Insights
Stem-Cell & Regenerative-Medicine Workflows Adopt Closed-System Cytometers
Allogeneic developers now mandate closed-system sorters, such as the MACSQuant Tyto and AQUIOS STEM, to isolate CD34+ cells without ambient exposure, following FDA guidance linking open-air sorting to contamination in clinical-grade batches. Contract development organizations report 40% fewer failed lots, cutting autologous CAR-T manufacturing from 21 days to 16 days, a time saving that directly affects patient backlog. Regenerative-medicine projects, including osteoarthritis trials employing mesenchymal stromal cells, now account for 18% of new sorter placements, up from 11% in 2023. Vendors able to retrofit legacy jet-in-air systems with disposable fluidics gain an advantage, while smaller firms struggle to finance the redesign needed for GMP compliance. In regions where reimbursement lags, hospitals consider reagent-rental contracts to offset cap-ex outlays for closed-system upgrades.
Clinical Diagnostics Adoption of Spectral Cytometers for Minimal Residual Disease
Spectral analyzers detect one leukemic cell among 1 million healthy cells, a sensitivity conventional instruments cannot match without multiple tubes. Thermo Fisher introduced the Attune Xenith in 2025, resolving 24-color panels in a single run and eliminating sequential staining that once consumed two working days. U.S. reimbursement now covers 19-color MRD panels at USD 487, making spectral instruments economic for community oncology centers. Cytek's Aurora Evo doubles acquisition speed to 70,000 events per second, enabling reference labs to process 120 MRD samples per 8-hour shift. As guidelines from the European Society for Medical Oncology endorsed spectral flow for MRD in acute lymphoblastic leukemia, procurement cycles accelerated across Germany, France, and the United Kingdom.
Other drivers and restraints analyzed in the detailed report include:
- AI-Guided Spectral Unmixing & Auto-Gating Shorten Core-Lab Turnaround
- Multi-Parametric Immuno-Oncology Panels Spur High-Parameter Purchases
- Shortage of Skilled Cytometrists Shifts Testing to Reference Labs
- EU MDR / IVDR Reagent Registration Delays
For complete list of drivers and restraints, kindly check the Table Of Contents.
Segment Analysis
Instruments held the largest 42.55% revenue share in 2025, reflecting budget cycles favoring spectral sorters with imaging modules and acoustic-focusing chambers. Reagents and consumables provide recurring revenue, with high-parameter immuno-oncology kits now accounting for 31% of consumables, stabilizing vendor cash flow even as capital spending fluctuates. Software is the fastest-growing element, advancing at a 13.25% CAGR to 2031 as cloud-native analytics with auto-gating engines and GDPR-compliant data residency penetrate multi-site trials JIM. Installation and remote-support contracts offset local cytometrist shortages, cutting downtime by 60% but adding notable annual operating fees.
Cell analyzer shipments dominate clinical diagnostics because regulatory clearance and throughput are paramount, while sorters dominate R&D budgets that require rare-cell isolation for downstream omics. Antibody supply disruptions such as the 2024 European conjugation-facility fire highlight the value of diversified supply chains and validated substitute clones. Dyes, beads, and compensation controls certified under ISO 17034 accelerate quality-control workflows in GMP environments. Pre-optimized MRD or CAR-T characterization panels now cut assay development from six months to four weeks, supporting aggressive clinical timelines.
Cell-based assays constituted 65.53% of revenue in 2025, anchored by immunophenotyping and apoptosis applications across diagnostics and research. Imaging flow cytometry, though smaller, grows at a 15.85% CAGR, propelled by pharmaceutical demand for morphology-based rare-cell detection in antibody-drug conjugate internalization studies. Bead-based multiplex flow remains important in high-plex immunoassays but faces competition from planar arrays offering higher throughput at lower cost. Acoustic-focusing cytometers reduce sheath-fluid consumption by 70%, appealing to laboratories in regions with water constraints.
Japan's fast-track pathway for imaging platforms used in circulating tumor-cell enumeration provides domestic vendors a nine-month time-to-market lead over Western competitors. Imaging cytometry's USD 400,000-600,000 capital cost limits broader adoption, creating a two-tier market between research-intensive centers and mid-tier hospitals. The flow cytometry market size for imaging platforms is forecast to exceed USD 1.6 billion by 2031, reflecting the modality's rapid expansion into oncology and gene-therapy workflows.
Geography Analysis
North America led with 41.13% revenue in 2025, underpinned by Medicare's 19-color MRD reimbursement code and multibillion-dollar pharmaceutical R&D spend that favors high-parameter cytometry. The United States alone invested USD 102 billion in drug discovery during 2024, creating strong demand for spectral analyzers in early-stage oncology trials. Canada's provincial systems centralized MRD testing by installing 12 spectral instruments in Ontario and British Columbia, improving access in remote communities. Mexico's INCAN upgraded to imaging platforms to support domestic CAR-T trials, positioning itself as a regional cell-therapy hub.
Asia-Pacific is the fastest-growing region, with a 12.51% CAGR, driven by China's approvals for locally built spectral systems priced 30% below imports. Mindray captured 9% of Chinese placements in 2025 through reagent-rental bundles that lock per-test costs for three years. India's government oncology centers added 14 high-parameter analyzers to execute 2 million planned leukemia screens annually by 2027. Japan fast-tracked the development of imaging cytometry for circulating tumor cells, giving domestic firms a head start across Asia.
Europe, in IVDR transition, faces catalog backlogs but remains a premium instrument market. German university hospitals spent EUR 18 million upgrading spectral sorters for CAR-T studies. The United Kingdom consolidated flow services into seven hubs, trimming MRD cost per test by 22%. France approved six new spectral platforms, intensifying competition and sinking average selling prices by 8%. Italy and Spain prioritize reagent cost containment, delaying high-parameter upgrades unless tied to transplant programs.
Middle East & Africa installed 22 spectral analyzers across Saudi Arabia and the United Arab Emirates to bolster national cancer registries. South America faces currency headwinds; Brazil's public laboratories shift toward reagent-rental to offset cap-ex. Overall, regional policy support and local manufacturing capacity increasingly define adoption trajectories, creating differentiated growth curves across continents.
- Agilent Technologies (ACEA)
- Apogee Flow Systems
- BD Biosciences (Becton, Dickinson & Co.)
- Beckman Coulter Life Sciences (Danaher)
- Bio-Rad Laboratories
- Curiox Biosystems
- Cytek Biosciences
- Immudex
- Luminex (DiaSorin Group)
- Merck KGaA (MilliporeSigma)
- Miltenyi Biotec
- Mindray
- NanoCellect Biomedical
- On-Chip Biotechnologies
- Sony Biotechnology
- Standard BioTools (Fluidigm)
- Stratedigm
- Sysmex
- Thermo Fisher Scientific (Invitrogen)
- Union Biometrica
Additional Benefits:
- The market estimate (ME) sheet in Excel format
- 3 months of analyst support
TABLE OF CONTENTS
1 Introduction
- 1.1 Study Assumptions & Market Definition
- 1.2 Scope of the Study
2 Research Methodology
3 Executive Summary
4 Market Landscape
- 4.1 Market Overview
- 4.2 Market Drivers
- 4.2.1 Stem-Cell & Regenerative-Medicine Workflows Adopt Closed-System Cytometers
- 4.2.2 Clinical Diagnostics Adoption of Spectral Cytometers for Minimal Residual Disease
- 4.2.3 AI-Guided Spectral Unmixing & Auto-Gating Shortens Core-Lab Turnaround
- 4.2.4 Point-of-Care Microfluidic Cytometers Penetrate Emerging Markets
- 4.2.5 Multi-Parametric Immuno-Oncology Panels Spur High-Parameter Purchases
- 4.2.6 GDPR/IVDR-Ready Cloud Analytics Platforms Expand Across Europe
- 4.3 Market Restraints
- 4.3.1 Shortage of Skilled Cytometrists Shifts Testing to Reference Labs
- 4.3.2 EU MDR / IVDR Reagent Registration Delays
- 4.3.3 Capital Cost of Image-Enabled Spectral Sorters
- 4.3.4 Cyber-Security & Data-Sovereignty Concerns in Government Hospitals
- 4.4 Supply-Chain Analysis
- 4.5 Regulatory Landscape
- 4.6 Technological Outlook
- 4.7 Porter's Five Forces
- 4.7.1 Threat of New Entrants
- 4.7.2 Bargaining Power of Buyers
- 4.7.3 Bargaining Power of Suppliers
- 4.7.4 Threat of Substitutes
- 4.7.5 Intensity of Competitive Rivalry
5 Market Size & Growth Forecasts (Value, USD)
- 5.1 By Product & Service
- 5.1.1 Instruments
- 5.1.1.1 Cell Analyzers
- 5.1.1.2 Cell Sorters
- 5.1.2 Reagents & Consumables
- 5.1.2.1 Antibodies
- 5.1.2.2 Dyes & Beads
- 5.1.2.3 Kits & Panels
- 5.1.3 Software
- 5.1.4 Services
- 5.1.1 Instruments
- 5.2 By Technology
- 5.2.1 Cell-Based Flow Cytometry
- 5.2.2 Bead-Based Flow Cytometry
- 5.2.3 Imaging Flow Cytometry
- 5.2.4 Acoustic-Focusing Flow Cytometry
- 5.3 By Application
- 5.3.1 Clinical Diagnostics
- 5.3.1.1 Oncology
- 5.3.1.2 Hematology
- 5.3.1.3 Infectious Diseases
- 5.3.1.4 Organ Transplantation
- 5.3.2 Drug Discovery & Development
- 5.3.3 Stem-Cell Therapy & Regenerative Medicine
- 5.3.4 Immunology
- 5.3.5 Other Applications
- 5.3.1 Clinical Diagnostics
- 5.4 By End-User
- 5.4.1 Hospitals & Clinics
- 5.4.2 Pharmaceutical & Biotechnology Companies
- 5.4.3 Contract Research & Reference Laboratories
- 5.4.4 Other End-Users
- 5.5 By Geography
- 5.5.1 North America
- 5.5.1.1 United States
- 5.5.1.2 Canada
- 5.5.1.3 Mexico
- 5.5.2 Europe
- 5.5.2.1 Germany
- 5.5.2.2 United Kingdom
- 5.5.2.3 France
- 5.5.2.4 Italy
- 5.5.2.5 Spain
- 5.5.2.6 Rest of Europe
- 5.5.3 Asia-Pacific
- 5.5.3.1 China
- 5.5.3.2 Japan
- 5.5.3.3 India
- 5.5.3.4 South Korea
- 5.5.3.5 Australia
- 5.5.3.6 Rest of Asia-Pacific
- 5.5.4 Middle East & Africa
- 5.5.4.1 GCC
- 5.5.4.2 South Africa
- 5.5.4.3 Rest of Middle East & Africa
- 5.5.5 South America
- 5.5.5.1 Brazil
- 5.5.5.2 Argentina
- 5.5.5.3 Rest of South America
- 5.5.1 North America
6 Competitive Landscape
- 6.1 Market Concentration
- 6.2 Market Share Analysis
- 6.3 Company Profiles (includes Global-level Overview, Market-level Overview, Core Segments, Financials, Strategic Information, Market Rank/Share for key companies, Products & Services, Recent Developments)
- 6.3.1 Agilent Technologies (ACEA)
- 6.3.2 Apogee Flow Systems
- 6.3.3 BD Biosciences (Becton, Dickinson & Co.)
- 6.3.4 Beckman Coulter Life Sciences (Danaher)
- 6.3.5 Bio-Rad Laboratories
- 6.3.6 Curiox Biosystems
- 6.3.7 Cytek Biosciences
- 6.3.8 Immudex
- 6.3.9 Luminex (DiaSorin Group)
- 6.3.10 Merck KGaA (MilliporeSigma)
- 6.3.11 Miltenyi Biotec
- 6.3.12 Mindray
- 6.3.13 NanoCellect Biomedical
- 6.3.14 On-Chip Biotechnologies
- 6.3.15 Sony Biotechnology
- 6.3.16 Standard BioTools (Fluidigm)
- 6.3.17 Stratedigm
- 6.3.18 Sysmex Corporation
- 6.3.19 Thermo Fisher Scientific (Invitrogen)
- 6.3.20 Union Biometrica
7 Market Opportunities & Future Outlook
- 7.1 White-Space & Unmet-Need Assessment

