
PUBLISHER: Mordor Intelligence | PRODUCT CODE: 2063581

PUBLISHER: Mordor Intelligence | PRODUCT CODE: 2063581
Image-Based Cytometry In Cell Analysis - Market Share Analysis, Industry Trends & Statistics, Growth Forecasts (2026 - 2031)
According to Mordor Intelligence, the image-Based cytometry in cell analysis market size is expected to increase from USD 3.62 billion in 2025 to USD 3.98 billion in 2026 and reach USD 6.68 billion by 2031, growing at a CAGR of 10.90% over 2026-2031.
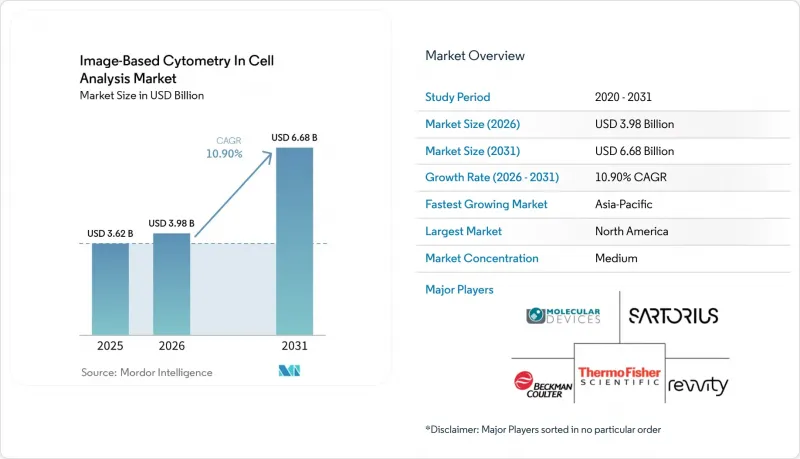
This report is Segmented by Product (Instruments, Consumables & Reagents, and More), Application (Drug Discovery & Development, and More), End User (Pharmaceutical & Biotechnology Companies, and More), and Geography (North America, Europe, Asia-Pacific, Middle East and Africa, South America). The Market Forecasts are Provided in Terms of Value (USD).
Global Image-Based Cytometry In Cell Analysis Market Trends and Insights
AI-Accelerated Image Analysis Scales Phenotypic Screening and Predictive Toxicology
Deep-learning models are raising accuracy and throughput in image-based phenotypic screens compared with manual pipelines, with CG-RecNet reporting 96.40% accuracy for label-free neural stem cell lineage classification in imaging flow cytometry. An end-to-end model known as PhenoProfiler achieved a 20% accuracy improvement over ResNet50 baselines on a large high-content dataset while removing multi-step preprocessing, which shortens setup time and reduces expert effort. Commercial platforms that combine chemical features with Cell Painting image descriptors have shown stronger toxicity prediction than image-only models, which helps teams find liabilities sooner in the hit-to-lead cycle. These gains are steering teams away from descriptive morphology libraries to predictive models that map to mechanism of action and safety risk early in discovery workflows. U.S. guidance on electronic systems and records in clinical investigations is also pushing sponsors to document model validation and maintain traceable, tamper-evident data, which supports the acceptance of algorithmic endpoints when validation evidence is in place.
Rapid Uptake of 3D Cell Models and Organoids Requiring Advanced Image Cytometry
Organoids and other 3D cell models are gaining share in preclinical studies due to stronger alignment with clinical outcomes, with brightfield imaging-based drug response metrics achieving 75-85% concordance with patient results in recent datasets. Imaging hardware and workflows are adapting with microfluidic agarose chips that raise organoid-throughput by 35-fold versus manual methods while preserving sample integrity during acquisition. Label-free analysis with virtual staining now scores T cell activation in co-culture without fluorescent labels that alter cellular metabolism, which supports longitudinal studies and preserves material for multi-omics assays. Studies continue to show meaningful inter-lab variability in spheroid metrics such as size when media composition and seeding densities differ, which underscores the need for standardized protocols and metadata. Modular, automated culture and imaging platforms are emerging to stabilize throughput and measurement repeatability in large organoid screens and to reduce operator effects over multi-day experiments.
High Capital and Operating Costs for Advanced Imaging Cytometers and Reagents
Advanced systems require significant purchase and service commitments, which strain budgets for smaller labs and for institutions in emerging markets. Operating expenses extend to environmental control modules and consumables for long-term lapse studies, which adds recurring cost on top of annual maintenance. Protocols that rely on fluorescence require anti-fade chemistries and photobleaching mitigations, which add to reagent outlays in high-throughput screening. Shared core facilities can offset capital barriers by pooling access to premium platforms, although locations and time allocations favor better-resourced centers. The uneven spread of imaging cores and expertise can reinforce regional disparities in throughput and productivity in large discovery programs.
Other drivers and restraints analyzed in the detailed report include:
- Potency Assurance in Cell & Gene Therapies Elevates Demand for Quantitative Imaging Assays
- Live-Cell Kinetic Imaging Enabling Longitudinal, Non-Perturbing Cell Analytics
- Data Volume, Storage, and Analytics Complexity, Along With Talent Shortages in Bioimage Informatics
For complete list of drivers and restraints, kindly check the Table Of Contents.
Segment Analysis
Consumables & Reagents held 58.51% of the Image-Based Cytometry in Cell Analysis market share in 2025, supported by recurring demand for dye panels, antibodies, plates, and buffers in routine screening. The Image-Based Cytometry in Cell Analysis market size dynamics increasingly hinge on software growth, since Software & Image Analysis is projected to deliver a 12.89% CAGR over 2026-2031 as users shift to subscription analytics and automated interpretation. Deep-learning phenotypic analysis is becoming standard inside enterprise platforms, which reduces operator dependence and makes outcomes more predictable at scale. Vendors that productize robust segmentation, feature extraction, and classification into turnkey modules are lowering the barrier for labs without dedicated bioimage analysis teams. Tighter links between acquisition and analytics, plus compliance-friendly data pipelines, are strengthening customer lock-in after qualification in GxP workflows.
Software & Image Analysis is set to outpace hardware as users fund automation that scales across instruments and sites, while consumables growth follows the expanding installed base in large screening programs. The Image-Based Cytometry in Cell Analysis industry continues to reward solutions that couple AI accuracy with explainable outputs and stable performance across batches, which reduces false positives in phenotypic screens.
Pricing models are moving from upfront licenses toward usage-based billing linked to data analyzed, which aligns spending to delivered value. Competition favors ecosystems that ease method transfer into regulated manufacturing and clinical support settings with proper audit trails and data integrity safeguards. Over the forecast period, this mix raises the strategic weight of software roadmaps relative to standalone hardware upgrades in the Image-Based Cytometry in Cell Analysis Market.
Geography Analysis
North America held 47.44% in 2025. The regional lead in North America reflects a concentration of pharmaceutical sponsors, translational research centers, and early adoption of AI-enabled analysis under clear expectations for electronic records and data integrity. Strong live-cell imaging adoption across U.S. R&D groups also supports performance gains when scaling phenotypic screening and kinetic assays at plate scale. The Image-Based Cytometry in Cell Analysis market size in North America benefits from extensive core-facility networks and vendor presence, which shortens deployment timelines for new imaging software and compliant data pipelines.
Asia-Pacific is projected as the fastest-growing region with a 12.32% CAGR through 2031 for the Image-Based Cytometry in Cell Analysis Market. Asia-Pacific is building capacity across CROs and translational hubs to support discovery, potency testing, and organoid imaging, which is raising utilization across biopharma partnerships. Adoption of label-free assays and virtual staining tools supports longitudinal imaging on fragile samples and reduces perturbation in immunology and oncology studies. Hardware innovation around microfluidic organoid platforms is increasing throughput and driving down manual handling, which aligns with expanding screening programs in key APAC research centers. As more programs move from research use to regulated workflows, the need for secure imaging data management and auditable records will shape software procurement in APAC. This growth profile positions Asia-Pacific as the key engine for incremental demand in the Image-Based Cytometry in Cell Analysis Market.
Europe's demand is steady across discovery and translational use, with momentum in academic-industry consortia that standardize imaging workflows and expand access to advanced platforms. The EU AI Act labels many healthcare image-analysis systems as high risk, which raises documentation needs and post-market monitoring but provides a harmonized route for deployment. Regions in the Middle East and Africa and in South America continue to expand imaging capability at select hubs, often through targeted initiatives and core facility investments that improve access to high-content and live-cell platforms. Over the forecast, procurement decisions across Europe and other regions will reward vendors with strong compliance tooling and clear support for validated image assays in the Image-Based Cytometry in Cell Analysis Market.
- Agilent Technologies
- Beckman Coulter Life Sciences
- ChemoMetec
- Cytek Biosciences
- DeNovix
- Evident (Olympus)
- Miltenyi Biotec
- Molecular Devices
- Nikon Instruments
- Phasefocus
- Revvity
- Sartorius
- SYNENTEC
- Tecan Group
- Thermo Fisher Scientific
- Yokogawa Electric
- ZEISS
Additional Benefits:
- The market estimate (ME) sheet in Excel format
- 3 months of analyst support
TABLE OF CONTENTS
1 Introduction
- 1.1 Study Assumptions & Market Definition
- 1.2 Scope of the Study
2 Research Methodology
3 Executive Summary
4 Market Landscape
- 4.1 Market Overview
- 4.2 Market Drivers
- 4.2.1 AI-accelerated image analysis scales phenotypic screening and predictive toxicology
- 4.2.2 Expansion of drug discovery & development workflows using high-content imaging
- 4.2.3 Rapid uptake of 3D cell models and organoids requiring advanced image cytometry
- 4.2.4 Live-cell kinetic imaging enabling longitudinal, non-perturbing cell analytics
- 4.2.5 Potency assurance in cell & gene therapies elevates demand for quantitative imaging assays
- 4.2.6 Data-integrity and audit-trail compliance (21 CFR Part 11) push validated image-data platforms
- 4.3 Market Restraints
- 4.3.1 High capital and operating costs for advanced imaging cytometers and reagents
- 4.3.2 Data volume, storage, and analytics complexity; talent shortages in bioimage informatics
- 4.3.3 Phototoxicity/photobleaching constraints limiting live-cell assay fidelity and throughput
- 4.3.4 Validation and metric-standardization gaps for AI pipelines in regulated use cases
- 4.4 Supply-Chain Analysis
- 4.5 Regulatory Landscape
- 4.6 Technological Outlook
- 4.7 Porter's Five Forces
- 4.7.1 Threat of New Entrants
- 4.7.2 Bargaining Power of Suppliers
- 4.7.3 Bargaining Power of Buyers
- 4.7.4 Threat of Substitutes
- 4.7.5 Industry Rivalry
5 Market Size & Growth Forecasts (Value, USD)
- 5.1 By Product
- 5.1.1 Instruments
- 5.1.2 Consumables & Reagents
- 5.1.3 Software & Image Analysis
- 5.1.4 Services
- 5.2 By Application
- 5.2.1 Drug Discovery & Development
- 5.2.2 Advanced Cell Models
- 5.2.3 Cell & Gene Therapy Analytics
- 5.2.4 Clinical Research & Diagnostics
- 5.3 By End User
- 5.3.1 Pharmaceutical & Biotechnology Companies
- 5.3.2 Academic & Research Institutes
- 5.3.3 CROs & CDMOs
- 5.3.4 Hospitals & Clinical Laboratories
- 5.4 By Geography
- 5.4.1 North America
- 5.4.1.1 United States
- 5.4.1.2 Canada
- 5.4.1.3 Mexico
- 5.4.2 Europe
- 5.4.2.1 Germany
- 5.4.2.2 United Kingdom
- 5.4.2.3 France
- 5.4.2.4 Italy
- 5.4.2.5 Spain
- 5.4.2.6 Rest of Europe
- 5.4.3 Asia-Pacific
- 5.4.3.1 China
- 5.4.3.2 Japan
- 5.4.3.3 India
- 5.4.3.4 Australia
- 5.4.3.5 South Korea
- 5.4.3.6 Rest of Asia-Pacific
- 5.4.4 Middle East and Africa
- 5.4.4.1 GCC
- 5.4.4.2 South Africa
- 5.4.4.3 Rest of Middle East and Africa
- 5.4.5 South America
- 5.4.5.1 Brazil
- 5.4.5.2 Argentina
- 5.4.5.3 Rest of South America
- 5.4.1 North America
6 Competitive Landscape
- 6.1 Market Concentration
- 6.2 Market Share Analysis
- 6.3 Company Profiles {(includes Global level Overview, Market level overview, Core Segments, Financials as available, Strategic Information, Market Rank/Share for key companies, Products & Services, and Recent Developments)}
- 6.3.1 Agilent Technologies
- 6.3.2 Beckman Coulter Life Sciences
- 6.3.3 ChemoMetec
- 6.3.4 Cytek Biosciences
- 6.3.5 DeNovix
- 6.3.6 Evident (Olympus)
- 6.3.7 Miltenyi Biotec
- 6.3.8 Molecular Devices
- 6.3.9 Nikon Instruments
- 6.3.10 Phasefocus
- 6.3.11 Revvity
- 6.3.12 Sartorius
- 6.3.13 SYNENTEC
- 6.3.14 Tecan Group
- 6.3.15 Thermo Fisher Scientific
- 6.3.16 Yokogawa Electric Corporation
- 6.3.17 ZEISS
7 Market Opportunities & Future Outlook
- 7.1 White-space & unmet-need assessment

