
PUBLISHER: Mordor Intelligence | PRODUCT CODE: 2061539

PUBLISHER: Mordor Intelligence | PRODUCT CODE: 2061539
Polymer Electrolyte Membrane Fuel Cells (PEMFC) - Market Share Analysis, Industry Trends & Statistics, Growth Forecasts (2026 - 2031)
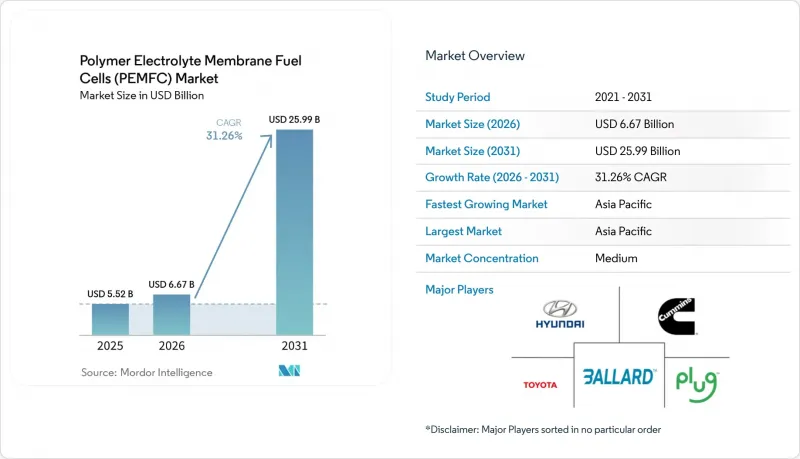
According to Mordor Intelligence, the polymer electrolyte membrane fuel cells (PEMFC) market size is estimated at USD 6.67 billion in 2026, and is expected to reach USD 25.99 billion by 2031, at a CAGR of 31.26% during the forecast period (2026-2031).
This report is Segmented by Type (Low-Temperature and High-Temperature), Cooling Method (Air-Cooled and Liquid-Cooled), Power Output (10 To 100 KW, Above 100 KW, and More), Component (Membrane Electrode Assembly, Catalysts, and More), Application (Transportation, and More), End-User Industry (Transportation, Utilities, and More), and Geography (Europe, Asia-Pacific, and More).
Global Polymer Electrolyte Membrane Fuel Cells (PEMFC) Market Trends and Insights
Government Zero-Emission Mandates & Subsidies
Mandates now oblige fleet owners to phase out diesel across ports, logistics corridors, and municipal fleets. California's rule, effective 2024, compels all new drayage trucks to be zero-emission, while the EU's revised heavy-duty CO2 standards target a 90% cut by 2040, spurring fuel cell or battery adoption for long-haul. China extended its New Energy Vehicle subsidy through 2025, earmarking CNY 3.7 billion for commercial FCEVs and matching support at provincial levels. South Korea's roadmap funds 850,000 FCEVs and 1,200 hydrogen stations by 2030. These synchronized policies underpin offtake security that justifies private investment in large-scale stack production and dispensing networks.
Rapid Decline in PEM Stack Cost Due to Gigafactory Scale
Rochester's 1 GW gigafactory, commissioned by Plug Power in late 2025, demonstrated a 35% cost drop by unifying MEA coating, plate stamping, and end-of-line testing under one roof. Hyundai's Guangzhou plant already targets USD 50 per kW stacks by 2027 through automated cell placement, while Bosch leverages automotive tolerances to drive scrap below 2%. U.S. DOE roadmaps confirm traction, reporting 2024 stack costs at USD 60 per kW, one year ahead of plan. Such economies open price-sensitive niches like material handling and telecom backup that previously favored diesel engines.
High Platinum-Group Metal Cost Exposure
Platinum averaged USD 1,050 per troy oz in 2025, inflating catalyst bills to roughly USD 1,000 for an 80 kW automotive stack. Recycling helps: Toyota's closed-loop program recovers 95% of platinum from retired modules, trimming virgin demand by 12,000 oz annually. Yet Ballard reports every 10% uptick in platinum price erodes gross margin by 2.5 points unless passed to customers. Research into iron-nitrogen-carbon catalysts hits 60% of platinum activity but falls short of durable service life, meaning exposure persists at least through mid-forecast.
Other drivers and restraints analyzed in the detailed report include:
- Expansion of Hydrogen Refueling Infrastructure
- Automaker FCEV Production Commitments Beyond 2025
- Looming Iridium & Platinum Supply Bottlenecks
For complete list of drivers and restraints, kindly check the Table Of Contents.
Segment Analysis
High-temperature stacks will grow at 35.8% through 2031, even though low-temperature units owned 73.5% of 2025 sales. Industrial operators value 120 °C-180 °C operation because the waste heat can be recuperated for process loads, cutting balance-of-plant spending by 25%. Serenergy's 5 kW installs in Danish apartment blocks in 2025 delivered 90% combined efficiency by channeling exhaust heat into radiators. Low-temperature designs remain standard for vehicles owing to quick cold starts and 4 kW L-1 power density. However, phosphoric-acid-doped polybenzimidazole membranes now show 10,000-hour durability, shrinking the density gap and suggesting high-temperature adoption may broaden where refined hydrogen is scarce.
Liquid-cooled stacks covered 70.1% of 2025 volume and will expand at a 32.5% CAGR, essential once outputs exceed 30 kW. Deionized water or glycol circuits keep cells within the 65 °C-75 °C sweet spot, allowing 4 kW L-1 density even if radiators add 15% weight. Horizon's hybrid cooling launched in 2025 toggles between air and liquid, trimming parasitic draw by 8%. Maritime uses underline liquid's relevance: Wartsila's 1.2 MW ship module dissipates 600 kW of heat to seawater, an impossible feat with air-only cooling. Air-cooled units stay relevant for telecom and forklifts where simplicity overrides peak power.
Geography Analysis
Asia-Pacific commanded 47.6% of the polymer electrolyte membrane fuel cell (PEMFC) market share in 2025 and should grow at 33.1% through 2031. China deployed 428 hydrogen stations, with Guangdong, Shandong, and Hebei subsidizing 40% of truck purchase costs. Japan extended its Ene-Farm rebate to 2027 and targets 5.3 million home installs by 2030. South Korea funds 850,000 FCEVs and 1,200 stations, while India's National Hydrogen Mission mandates 10% refinery hydrogen be green by 2027. Australia concentrates on export ammonia, with limited domestic uptake outside mining equipment.
Europe's hydrogen backbone will repurpose 28,000 km of pipelines by 2027, lowering delivered hydrogen 30% below trucking costs. Germany assigned EUR 9 billion to electrolyzers and heavy-duty truck incentives, France targets 6.5 GW electrolysis by 2030, and the U.K. clusters on HyNet. Nordic hydropower underwrites low-carbon hydrogen export deals. Policy alignment under RED III mandates 42% renewable hydrogen in industry by 2030, anchoring future demand.
North America benefits from the USD 8 billion federal hub program. The Gulf Coast hub aims at 1.2 GW of blue hydrogen for refineries, whereas California drayage rules push trucking demand. Canada's Becancour plant will export 88,000 t of green hydrogen to Europe. Mexico, South America, and the Middle East remain nascent, skewing current deployments toward export ammonia rather than domestic fuel cells.
- Ballard Power Systems
- Plug Power Inc.
- Cummins Inc.
- Toyota Motor Corporation
- Hyundai Motor Company
- Toshiba Corporation
- ITM Power PLC
- PowerCell Sweden AB
- Intelligent Energy Limited
- Doosan Fuel Cell Co., Ltd.
- Bloom Energy Corporation
- FuelCell Energy Inc.
- Panasonic Corporation
- Ceres Power Holdings plc
- Nedstack Fuel Cell Technology BV
- ElringKlinger AG
- Symbio SAS
- Robert Bosch GmbH
- Horizon Fuel Cell Technologies
- SFC Energy AG
Additional Benefits:
- The market estimate (ME) sheet in Excel format
- 3 months of analyst support
TABLE OF CONTENTS
1 Introduction
- 1.1 Study Assumptions & Market Definition
- 1.2 Scope of the Study
2 Research Methodology
3 Executive Summary
4 Market Landscape
- 4.1 Market Overview
- 4.2 Market Drivers
- 4.2.1 Government zero-emission mandates & subsidies
- 4.2.2 Rapid decline in PEM stack $/kW due to gigafactory-scale production
- 4.2.3 Expansion of hydrogen refueling infrastructure in Asia, EU & US
- 4.2.4 Automaker FCEV production commitments beyond 2025
- 4.2.5 Second-life automotive PEM modules repurposed for containerised gensets
- 4.2.6 PFAS-free membrane breakthroughs enabling new suppliers
- 4.3 Market Restraints
- 4.3.1 High platinum-group metal cost exposure
- 4.3.2 Limited hydrogen distribution outside early-adopter regions
- 4.3.3 Looming iridium & platinum supply bottlenecks
- 4.3.4 SOFC competition for >=100 kW stationary projects
- 4.4 Supply-Chain Analysis
- 4.5 Regulatory Landscape
- 4.6 Technological Outlook
- 4.7 Porter's Five Forces
- 4.7.1 Bargaining Power of Suppliers
- 4.7.2 Bargaining Power of Buyers
- 4.7.3 Threat of New Entrants
- 4.7.4 Threat of Substitutes
- 4.7.5 Competitive Rivalry
5 Market Size & Growth Forecasts
- 5.1 By Type
- 5.1.1 Low-Temperature PEMFC
- 5.1.2 High-Temperature PEMFC
- 5.2 By Cooling Method
- 5.2.1 Air-Cooled
- 5.2.2 Liquid-Cooled
- 5.3 By Power Output
- 5.3.1 Below 1 kW
- 5.3.2 1 to 10 kW
- 5.3.3 10 to 100 kW
- 5.3.4 Above 100 kW
- 5.4 By Component
- 5.4.1 Fuel Cell Stack
- 5.4.2 Membrane Electrode Assembly
- 5.4.3 Bipolar Plates
- 5.4.4 Gas Diffusion Layers
- 5.4.5 Catalysts
- 5.4.6 Balance-of-Plant Components
- 5.5 By Application
- 5.5.1 Transportation
- 5.5.2 Stationary Power
- 5.5.3 Portable/Backup Power
- 5.6 By End-User Industry
- 5.6.1 Transportation
- 5.6.2 Utilities
- 5.6.3 Commercial and Industrial
- 5.6.4 Others (Defense, Residential)
- 5.7 By Geography
- 5.7.1 North America
- 5.7.1.1 United States
- 5.7.1.2 Canada
- 5.7.1.3 Mexico
- 5.7.2 Europe
- 5.7.2.1 United Kingdom
- 5.7.2.2 Germany
- 5.7.2.3 France
- 5.7.2.4 Spain
- 5.7.2.5 Nordic Countries
- 5.7.2.6 Russia
- 5.7.2.7 Rest of Europe
- 5.7.3 Asia-Pacific
- 5.7.3.1 China
- 5.7.3.2 India
- 5.7.3.3 Japan
- 5.7.3.4 South Korea
- 5.7.3.5 Malaysia
- 5.7.3.6 Thailand
- 5.7.3.7 Indonesia
- 5.7.3.8 Vietnam
- 5.7.3.9 Australia
- 5.7.3.10 Rest of Asia-Pacific
- 5.7.4 South America
- 5.7.4.1 Brazil
- 5.7.4.2 Argentina
- 5.7.4.3 Colombia
- 5.7.4.4 Rest of South America
- 5.7.5 Middle East and Africa
- 5.7.5.1 United Arab Emirates
- 5.7.5.2 Saudi Arabia
- 5.7.5.3 South Africa
- 5.7.5.4 Rest of Middle East and Africa
- 5.7.1 North America
6 Competitive Landscape
- 6.1 Market Concentration
- 6.2 Strategic Moves (M&A, Partnerships, PPAs)
- 6.3 Market Share Analysis (Market Rank/Share for key companies)
- 6.4 Company Profiles (includes Global level Overview, Market level overview, Core Segments, Financials as available, Strategic Information, Products & Services, and Recent Developments)
- 6.4.1 Ballard Power Systems
- 6.4.2 Plug Power Inc.
- 6.4.3 Cummins Inc.
- 6.4.4 Toyota Motor Corporation
- 6.4.5 Hyundai Motor Company
- 6.4.6 Toshiba Corporation
- 6.4.7 ITM Power PLC
- 6.4.8 PowerCell Sweden AB
- 6.4.9 Intelligent Energy Limited
- 6.4.10 Doosan Fuel Cell Co., Ltd.
- 6.4.11 Bloom Energy Corporation
- 6.4.12 FuelCell Energy Inc.
- 6.4.13 Panasonic Corporation
- 6.4.14 Ceres Power Holdings plc
- 6.4.15 Nedstack Fuel Cell Technology BV
- 6.4.16 ElringKlinger AG
- 6.4.17 Symbio SAS
- 6.4.18 Robert Bosch GmbH
- 6.4.19 Horizon Fuel Cell Technologies
- 6.4.20 SFC Energy AG
7 Market Opportunities & Future Outlook
- 7.1 White-Space & Unmet-Need Assessment

