
PUBLISHER: Mordor Intelligence | PRODUCT CODE: 2061553

PUBLISHER: Mordor Intelligence | PRODUCT CODE: 2061553
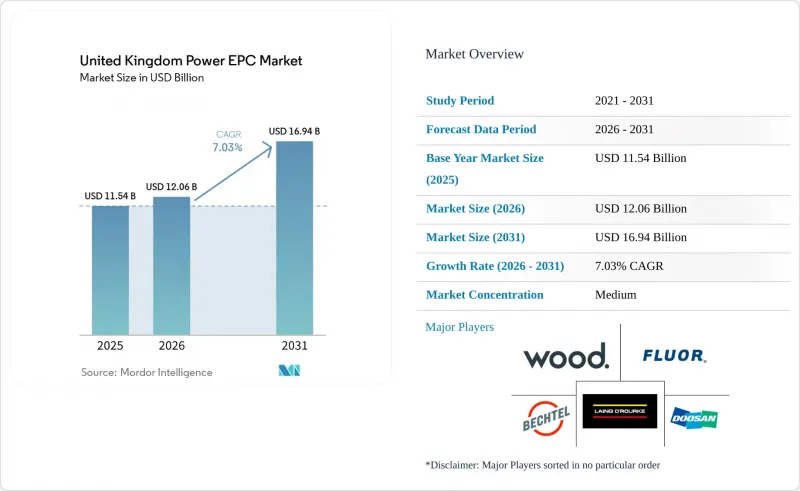
United Kingdom Power EPC - Market Share Analysis, Industry Trends & Statistics, Growth Forecasts (2026 - 2031)
According to Mordor Intelligence, the united kingdom power ePC market size is estimated at USD 12.06 billion in 2026, and is expected to reach USD 16.94 billion by 2031, at a CAGR of 7.03% during the forecast period (2026-2031).
This report is Segmented by Power Generation EPC [Technology (Thermal, Nuclear, and Renewables), Capacity Band (Up To 100 MW, 100 To 499 MW, and Above 500 MW), and End-User (Regulated Utilities, Independent Power Producers, Industrial Captive Power, and Public Sector and SOE)], and Power Transmission and Distribution (T&D) EPC. The Market Sizes and Forecasts are Provided in Terms of Value (USD).
United Kingdom Power EPC Market Trends and Insights
UK Offshore-Wind Megaproject Pipeline
Seabed rights awarded under ScotWind cover 17 projects totaling about 30 gigawatts, while Crown Estate Round 5 adds up to 4.5 gigawatts of floating capacity in the Celtic Sea. These allocations dwarf the 14 gigawatts already operating, compressing fabrication schedules and boosting demand for turbine foundations and export cables. Projects such as Orsted's 2.9-gigawatt Hornsea 3 require more than 200 turbines and over 100 kilometers of subsea cable, illustrating the scale shift. Floating-wind prototypes introduce dynamic-cable and mooring challenges that favor contractors with deepwater oil-and-gas experience. Grid reforms under the Clean Power 2030 Action Plan halve queue times to under 2.5 years, accelerating EPC contract awards. Together, these forces underpin the 12.8% CAGR forecast for renewables EPC.
Nuclear New-Build Revival Post-Sizewell C FID
July 2025 marked the USD 38.1 billion commitment to Sizewell C, the first large-scale nuclear FID since 2016. The Regulated Asset Base model transfers construction risk to consumers, cutting the cost of capital and unlocking EPC scopes covering civil works, reactor-island fabrication, and turbine-hall integration. Doosan Babcock and Ansaldo Nuclear are shortlisted for major packages. The government's 24-gigawatt nuclear target implies six to eight additional reactors or an SMR fleet, sustaining multidecade EPC workloads. Extended construction cycles of 10-12 years mean revenue recognition will carry well into the 2030s, rewarding contractors that navigate Office for Nuclear Regulation oversight.
Inflation-Driven EPC Cost Overruns
Construction input prices rose 5.6% year-over-year in 2024, while skilled labor costs climbed 6.2%. Fixed-price offshore-wind contracts signed in 2022-2023 now face margin compression as steel and marine-vessel rates exceed indexed clauses. Hinkley Point C's budget climbed from USD 33 billion at FID to USD 44.5 billion by 2025. Contractors are shifting toward cost-reimbursable models, easing execution risk but eroding bid competitiveness.
Other drivers and restraints analyzed in the detailed report include:
- Fast-Track Grid-Reinforcement Funding (RIIO-T3)
- PPAs Tied to Corporate Net-Zero Pledges
- Supply-Chain Bottlenecks in High-Voltage Equipment Imports
For complete list of drivers and restraints, kindly check the Table Of Contents.
Segment Analysis
Renewables captured 76.3% of 2025 generation EPC value and are projected to grow at a 12.8% CAGR through 2031, driven chiefly by offshore wind. ScotWind and Celtic Sea concessions require EPC outlays above GBP 40 billion (USD 50.8 billion). The sixth Contracts for Difference (CfD) round awarded 9.6 gigawatts at record-low strike prices, reinforcing cost competitiveness. Nuclear EPC revenue, dormant since 2016, resurged with the Sizewell C FID, which alone adds 3.2 gigawatts of capacity. Thermal EPC shrinks as coal retires and gas projects face capacity-market de-rating, though carbon-capture retrofits preserve a narrow niche funded by the GBP 20 billion CCUS program.
Projects exceeding 500 megawatts held 63.6% of the 2025 EPC value, dominated by Hornsea 3, Hornsea 4, and the Dogger Bank complex. Gigawatt-scale offshore arrays leverage turbine-procurement scale and optimized marine logistics yet endure 8-10-year development cycles that heighten regulatory risk. The 100-to-499-megawatt band grows moderately as land constraints cap onshore wind and solar acreage.
Installations up to 100 megawatts will post the fastest 9.1% CAGR as corporates deploy behind-the-meter solar-plus-storage and port-based microgrids. Teesside Freeport's Net Zero cluster demonstrates a modular energy-park model integrating hydrogen, carbon capture, and combined-heat-and-power within a sub-100-megawatt footprint. Ofgem's local flexibility markets compensate distributed resources, improving project economics for community-energy schemes backed by the GBP 10 million Community Energy Fund.
List of Companies Covered in this Report:
- Fluor Ltd
- Wood plc
- Bechtel Corp
- Doosan Babcock Ltd
- Ramboll UK Ltd
- Laing O'Rourke
- Orsted A/S
- Balfour Beatty
- General Electric Co.
- Siemens Energy AG
- ABB Ltd
- Hitachi Energy Ltd
- Prysmian Group
- Ansaldo Nuclear Ltd
- Mott MacDonald Ltd
- Kier Infrastructure
- Bouygues Energies & Services
- Vinci Energies UK
- Skanska UK
- Engie Solutions UK
Additional Benefits:
- The market estimate (ME) sheet in Excel format
- 3 months of analyst support
TABLE OF CONTENTS
1 Introduction
- 1.1 Study Assumptions & Market Definition
- 1.2 Scope of the Study
2 Research Methodology
3 Executive Summary
4 Market Landscape
- 4.1 Market Overview
- 4.2 Installed Capacity Outlook
- 4.3 Primary-Energy Consumption Snapshot
- 4.4 Market Drivers
- 4.4.1 UK offshore-wind megaproject pipeline
- 4.4.2 Nuclear new-build revival post-Sizewell C FID
- 4.4.3 Ageing thermal fleet repowering mandates
- 4.4.4 Fast-track grid-reinforcement funding (RIIO-T3)
- 4.4.5 PPAs tied to corporate net-zero pledges
- 4.4.6 Modular "energy-park" concepts adopted by UK ports
- 4.5 Market Restraints
- 4.5.1 Inflation-driven EPC cost overruns
- 4.5.2 Supply-chain bottlenecks in HV equipment imports
- 4.5.3 Public opposition to on-shore transmission corridors
- 4.6 Supply-Chain Analysis
- 4.7 Regulatory Landscape
- 4.8 Technological Outlook
- 4.9 Porter's Five Forces
- 4.9.1 Threat of New Entrants
- 4.9.2 Bargaining Power of Suppliers
- 4.9.3 Bargaining Power of Buyers
- 4.9.4 Threat of Substitutes
- 4.9.5 Competitive Rivalry
- 4.10 PESTLE Analysis
5 Market Size & Growth Forecasts
- 5.1 Power Generation EPC
- 5.1.1 By Technology
- 5.1.1.1 Thermal
- 5.1.1.2 Nuclear
- 5.1.1.3 Renewables
- 5.1.2 By Capacity Band
- 5.1.2.1 Up to 100 MW (DER, micro-grid)
- 5.1.2.2 100 to 499 MW
- 5.1.2.3 Above 500 MW
- 5.1.3 By End-User
- 5.1.3.1 Regulated Utilities
- 5.1.3.2 Independent Power Producers
- 5.1.3.3 Industrial Captive Power
- 5.1.3.4 Public Sector and SOE
- 5.1.1 By Technology
- 5.2 Power Transmission and Distribution (T&D) EPC
6 Competitive Landscape
- 6.1 Market Concentration
- 6.2 Strategic Moves (M&A, Partnerships, PPAs)
- 6.3 Market Share Analysis (Market Rank/Share for key companies)
- 6.4 Company Profiles (includes Global level Overview, Market level overview, Core Segments, Financials as available, Strategic Information, Products & Services, and Recent Developments)
- 6.4.1 Fluor Ltd
- 6.4.2 Wood plc
- 6.4.3 Bechtel Corp
- 6.4.4 Doosan Babcock Ltd
- 6.4.5 Ramboll UK Ltd
- 6.4.6 Laing O'Rourke
- 6.4.7 Orsted A/S
- 6.4.8 Balfour Beatty
- 6.4.9 General Electric Co.
- 6.4.10 Siemens Energy AG
- 6.4.11 ABB Ltd
- 6.4.12 Hitachi Energy Ltd
- 6.4.13 Prysmian Group
- 6.4.14 Ansaldo Nuclear Ltd
- 6.4.15 Mott MacDonald Ltd
- 6.4.16 Kier Infrastructure
- 6.4.17 Bouygues Energies & Services
- 6.4.18 Vinci Energies UK
- 6.4.19 Skanska UK
- 6.4.20 Engie Solutions UK
7 Market Opportunities & Future Outlook
- 7.1 White-Space & Unmet-Need Assessment

