
PUBLISHER: Mordor Intelligence | PRODUCT CODE: 2061554

PUBLISHER: Mordor Intelligence | PRODUCT CODE: 2061554
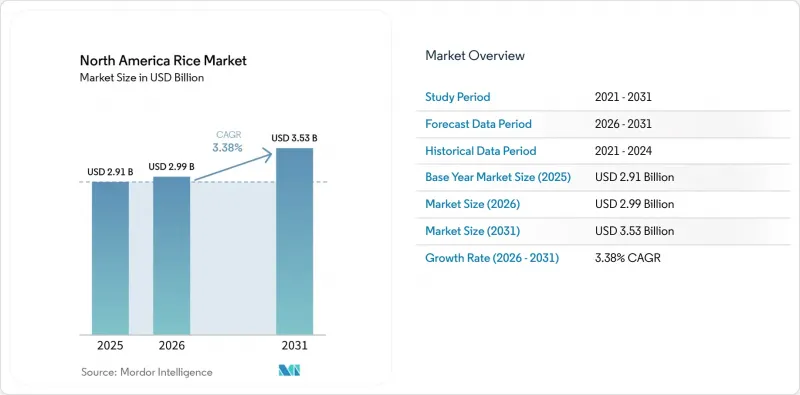
North America Rice - Market Share Analysis, Industry Trends & Statistics, Growth Forecasts (2026 - 2031)
According to Mordor Intelligence, the north america rice market size was valued at USD 2.91 billion in 2025 and is estimated to grow from USD 2.99 billion in 2026 to USD 3.53 billion by 2031, registering a CAGR of 3.38% in the forecast period (2026-2031).
This report is Segmented by Geography (United States, Canada, and Mexico). The Report Includes Production Analysis (Volume), Consumption Analysis (Value and Volume), Import Analysis (Value and Volume), Export Analysis (Value and Volume), Wholesale Price Trend Analysis and Forecast, List of Key Players, and More. The Market Forecasts are Provided in Terms of Value (USD) and Volume (Metric Tons).
North America Rice Market Trends and Insights
Resilient Hispanic-origin Population Demand
Hispanic and Asian communities consume more rice per capita than the general population, driving consistent demand. According to the United States Census Bureau, as of July 1, 2024, the Hispanic population in the United States reached 68 million, representing 20% of the total population growth. This population is primarily concentrated in Texas, California, and Florida. These demographic trends persist even as the United States milling capacity is projected to reach a 14-year low in 2025. In the foodservice sector, parboiled long-grain rice remains a preferred choice due to its superior steam-table holding characteristics, which make it particularly suitable for institutional and restaurant use. The United States rice milling industry maintains significant processing infrastructure, with a national milling capacity of approximately 72.6 million kilograms per day. This capacity is geographically distributed across multiple states to mitigate supply-chain concentration risks and enhance regional product availability. Increasing ethnic demand has also supported the continued expansion of retail shelf space for both bulk and value-added rice products in Hispanic-majority markets. These demographic and consumption patterns are anticipated to provide long-term stability for the North America rice market despite challenges such as evolving dietary preferences and periodic fluctuations in milling capacity.
Rapid Foodservice Recovery Post-COVID-19
According to data from the Bureau of Economic Analysis, spending at United States eating and drinking establishments reached an annualized USD 1,249.3 billion in Q2 2025, an increase from USD 1,223.3 billion in Q1 2025 . Bulk 25- and 50-pound purchases rose 14% year-on-year, driven by Mexican and Asian outlets. Riviana Foods Inc. completed a USD 80.6 million expansion in Memphis in 2024, doubling ready-to-serve cup capacity to meet quick-service demand. Institutional reopenings, including schools and hospitals, restored 180,000 metric tons of annual consumption, with operators favoring microwave pouches and cups. This foodservice recovery supports value-added processors and boosts revenue in the North America rice market.
Escalating Water-Use Restrictions in California
The California State Water Resources Control Board has periodically reduced surface-water allocations during droughts, affecting medium-grain rice production in the Sacramento Valley. Historically, rice acreage in California decreased due to limited water availability, and additional pressure was observed in 2025 amid ongoing irrigation constraints. Medium-grain rice, which typically commands premium pricing, depends heavily on continuously flooded cultivation systems in the state. However, competition from higher-return permanent crops, such as almonds, and anticipated declines in Sierra Nevada snowpack are raising long-term concerns about water availability. Persistent water shortages could tighten domestic supply and increase reliance on imports from countries such as Australia and Uruguay, potentially affecting the long-term stability of the North America rice market.
Other drivers and restraints analyzed in the detailed report include:
- Shift Toward Plant-Based Proteins in Pet-Food Manufacturing
- Rising Adoption of Alternate Wetting and Drying (AWD) Irrigation
- Elevated Fertilizer and Energy Input Volatility
For complete list of drivers and restraints, kindly check the Table Of Contents.
Additional Benefits:
- The market estimate (ME) sheet in Excel format
- 3 months of analyst support
TABLE OF CONTENTS
1 Introduction
- 1.1 Study Assumptions and Market Definition
- 1.2 Scope of the Study
2 Research Methodology
3 Executive Summary
4 Market Landscape
- 4.1 Market Overview
- 4.2 Market Drivers
- 4.2.1 Resilient Hispanic-origin population demand
- 4.2.2 Rapid foodservice recovery post-COVID-19
- 4.2.3 Shift toward plant-based proteins in pet-food manufacturing
- 4.2.4 Rising adoption of alternate wetting and drying (AWD) irrigation
- 4.2.5 Expansion of United States-Mexico phytosanitary harmonization programs
- 4.2.6 Price-hedging via futures attracts grower acreage
- 4.3 Market Restraints
- 4.3.1 Escalating water-use restrictions in California
- 4.3.2 Elevated fertilizer and energy input volatility
- 4.3.3 Labor shortages during peak harvest windows
- 4.3.4 Competition from low-cost Asian imports in Mexico
- 4.4 Opportunities
- 4.5 Challenges
- 4.6 Value Chain Analysis
- 4.7 Technologies and usage of AI in the Industry
- 4.8 Input Market Analysis
- 4.8.1 Seeds
- 4.8.2 Fertilizers
- 4.8.3 Crop Protection Chemicals
- 4.9 Distribution Channel Analysis
- 4.10 Market Sentiment Analysis
- 4.11 PESTLE Analysis
5 Market Size and Growth Forecast (Value and Volume)
- 5.1 By Geography
- 5.1.1 United States
- 5.1.1.1 Production Analysis (Area Harvested, Yield, and Production Volume)
- 5.1.1.2 Consumption Analysis (Consumption Value and Volume)
- 5.1.1.3 Import Market Analysis (Import Value, Volume, and Key Supplying Markets)
- 5.1.1.4 Export Market Analysis (Export Value, Volume, and Key Destination Markets)
- 5.1.1.5 Wholesale Price Trend Analysis and Forecast
- 5.1.1.6 Regulatory Framework
- 5.1.1.7 List of Key Players
- 5.1.1.8 Logistics and Infrastructure
- 5.1.1.9 Seasonality Analysis
- 5.1.2 Canada
- 5.1.2.1 Production Analysis (Area Harvested, Yield, and Production Volume)
- 5.1.2.2 Consumption Analysis (Consumption Value and Volume)
- 5.1.2.3 Import Market Analysis (Import Value, Volume, and Key Supplying Markets)
- 5.1.2.4 Export Market Analysis (Export Value, Volume, and Key Destination Markets)
- 5.1.2.5 Wholesale Price Trend Analysis and Forecast
- 5.1.2.6 Regulatory Framework
- 5.1.2.7 List of Key Players
- 5.1.2.8 Logistics and Infrastructure
- 5.1.2.9 Seasonality Analysis
- 5.1.3 Mexico
- 5.1.3.1 Production Analysis (Area Harvested, Yield, and Production Volume)
- 5.1.3.2 Consumption Analysis (Consumption Value and Volume)
- 5.1.3.3 Import Market Analysis (Import Value, Volume, and Key Supplying Markets)
- 5.1.3.4 Export Market Analysis (Export Value, Volume, and Key Destination Markets)
- 5.1.3.5 Wholesale Price Trend Analysis and Forecast
- 5.1.3.6 Regulatory Framework
- 5.1.3.7 List of Key Players
- 5.1.3.8 Logistics and Infrastructure
- 5.1.3.9 Seasonality Analysis
- 5.1.1 United States
6 End Use and Application
- 6.1 Primary Applications and Emerging Applications
- 6.2 Consumption Breakdown by Industries
7 Competitive Landscape
- 7.1 Overview of the Competition
- 7.2 Recent Developments
- 7.3 Market Concentration Analysis
- 7.4 List of Stakeholders
- 7.4.1 Riceland Foods Inc.
- 7.4.2 Riviana Foods Inc. (Ebro Foods S.A.)
- 7.4.3 Producers Rice Mill Inc.
- 7.4.4 Mars, Incorporated
- 7.4.5 Farmers' Rice Cooperative
- 7.4.6 Archer Daniels Midland Company
- 7.4.7 American Commodity Company LLC
- 7.4.8 SunWest Milling Co. LLC
- 7.4.9 Kennedy Rice Mill LLC
- 7.4.10 Louisiana Rice Mill LLC
- 7.4.11 Gulf Pacific Rice Company Inc.
- 7.4.12 Doguet's Rice Milling Company
- 7.4.13 Arrocera Los Pirineos S.A. de C.V. (Grupo Pirineos S.A. de C.V.)
- 7.4.14 Grupo Arrocero INH S.A. de C.V. (INH Agroindustrial S.A. de C.V.)
- 7.4.15 Arrocera San Francisco S.A. de C.V.
8 Market Opportunity and Future Outlook

