
PUBLISHER: Mordor Intelligence | PRODUCT CODE: 2061558

PUBLISHER: Mordor Intelligence | PRODUCT CODE: 2061558
Smart Meters - Market Share Analysis, Industry Trends & Statistics, Growth Forecasts (2026 - 2031)
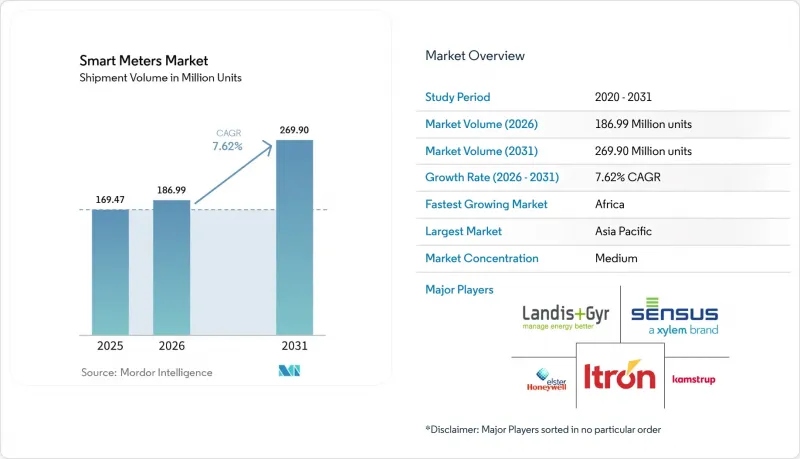
According to Mordor Intelligence, the smart meters market size in terms of shipment volume is expected to increase from 169.47 Million units in 2025 to 186.99 Million units in 2026 and reach 269.90 Million units by 2031, growing at a CAGR of 7.62% over 2026-2031.
This report is Segmented by Product Type (Smart Electricity Meters, Smart Gas Meters, and Smart Water Meters), Communication Technology (RF Mesh, Power-Line Communication (PLC), Cellular (2G-5G / NB-IoT / LTE-M), and LPWA), Component (Hardware, Software, and Services), End User (Residential, Commercial, and Industrial and Utilities), and Geography. The Market Forecasts are Provided in Terms of Volume (Units).
Global Smart Meters Market Trends and Insights
Government Mandates for Nationwide Roll-outs
Mandated deployments remain the most potent catalyst for the smart meters market. The European Union's Energy Efficiency Directive compelled members to reach 80% penetration, extending procurement pipelines for Landis and Gyr and Itron into 2026. California utilities completed state-ordered programs, and Texas retail competition continues to reward real-time pricing enabled by AMI. China's State Grid scheduled replacement of 300 Million meters during 2024-2029 to accommodate vehicle-to-grid functionality, a move absorbing capacity from Hexing Electrical and Wasion Holdings. India earmarked INR 3.03 Trillion (USD 36.4 Billion) under its Revamped Distribution Sector Scheme, awarding 2025 tenders to Larsen and Toubro and Energy Efficiency Services Limited. While mandates de-risk investment, they expose vendors to political delays that can compress margins when roll-out schedules slip.
Utility Efficiency and Non-Technical-Loss Reduction
Non-technical losses drain an estimated USD 96 Billion annually, and utilities in Nigeria, South Africa, and Latin America are using tamper-proof meters and remote disconnects to address the gap. Abuja Electricity Distribution Company cut losses by 15% within a year after installing 500,000 prepaid meters in 2024. Eskom's Johannesburg pilot utilized blockchain time stamping to thwart post-facto tampering, attracting interest across Kenya and Ghana. U.S. systems waste 6 Billion gallons daily, prompting Los Angeles and Phoenix to adopt acoustic leak detection that alerts crews within 15 minutes. Operational savings often recoup annualized AMI costs inside five years, making loss reduction a self-funding driver in cash-strapped territories.
High Upfront CAPEX and Long Payback Cycles
All-in deployment costs range from USD 150 to USD 300 per endpoint, translating into USD 150 Million-USD 300 Million for a 1 Million-customer utility. Payback can stretch to 8-12 years if regulators prohibit time-of-use tariffs or resource adequacy payments. Kenya Power paused a 3 Million-meter tender in 2024 after its National Treasury withheld loan guarantees over debt concerns. Argentina's Cordoba and Mendoza utilities similarly downsized tenders in 2025 after peso depreciation inflated imported meter costs by 40%. Water utilities feel an even tighter squeeze because cost-of-service rules cap returns at 6%-8%, limiting capital formation without subsidies.
Other drivers and restraints analyzed in the detailed report include:
- Grid Modernization and DER Integration Programs
- Smart-City and IoT Infrastructure Expansion
- Cyber-Security and Data-Privacy Risks
For complete list of drivers and restraints, kindly check the Table Of Contents.
Segment Analysis
Smart electricity meters commanded 70.84% share in 2025, reflecting decades of regulatory focus. The segment has reached high penetration in many developed grids, so growth aligns mainly with replacement cycles. Smart water meters, by contrast, are poised for a 9.62% CAGR to 2031 as cities target non-revenue water that often exceeds 30% of supply. Acoustic leak detection embedded in meters deployed by Los Angeles and Singapore in 2024-2025 demonstrated sub-15-minute burst identification, enabling crews to triage repairs without wholesale main replacement. Gas meters remain smaller in volume, yet Europe's Gas Directive drove nationwide roll-outs in Italy and the Netherlands by 2025, validating remote shut-off as a safety and billing tool.
Many municipalities still rely on quarterly manual reads or flat-rate billing, leaving substantial digital headroom. Compliance with ISO 24516 leak detection targets in the Middle East and Southern California adds urgency. Gas meter adoption remains constrained by lower energy density and minimal price differentiation throughout the day, reducing the benefit of granular interval data. However, safety regulations are nudging utilities toward automated shut-off, which could bolster smart gas penetration over the next decade.
RF mesh technology held a 57.24% share in 2025 because self-healing topology minimizes the need for licensed spectrum and supports dense urban deployments. Even so, narrowband IoT is projected to advance at an 8.02% CAGR through 2031. Vodafone and China Mobile slashed per-device data tariffs below USD 1 per month in 2024, realigning total cost of ownership and enabling utilities to outsource network operations. Power-line communication retains a foothold in European markets favoring PRIME and G3-PLC protocols, yet noisy feeders in parts of Asia and Africa limit scalability. Low-power wide-area networks such as LoRaWAN fill rural gaps but suffer from ecosystem fragmentation and limited roaming.
Utilities increasingly prefer cellular because 3GPP Release 17 extends battery life past 10 years while guaranteeing 99.5% uptime. The model converts capital outlay for private mesh into a predictable operating expense, aligning with regulatory requirements that favor rate-base efficiency. Mesh will remain relevant where density justifies localized relay, yet the growth trajectory clearly tilts toward licensed cellular platforms.
Geography Analysis
Asia Pacific secured 48.58% of the smart meters market share in 2025, powered by China's 14th Five-Year Plan and India's Revamped Distribution Sector Scheme. State Grid deployed 280 Million meters during 2020-2025, enabling time-of-use tariffs that shifted 12% of residential load to off-peak hours. Japan and South Korea, early adopters, are now upgrading first-generation devices to support vehicle-to-grid aggregation. Southeast Asia remains uneven; Thailand and Vietnam launched pilots in 2024 but face funding gaps, while Australia and New Zealand completed mandatory roll-outs by 2024 with a focus on rooftop solar integration.
Africa is the fastest expanding region at 8.44% CAGR to 2031. Nigeria's Meter Asset Provider program financed 4 Million prepaid meters, trimming aggregate losses from 35% to 28% inside 18 months. South Africa's split-prepaid systems allow mobile money purchases and remote disconnect, an approach Kenya, Ghana, and Tanzania are now testing. Egypt awarded Elsewedy Electric a USD 300 Million contract in 2025 to supply 5 Million meters under African Development Bank financing. Political risk and currency volatility temper near-term volume, but demographic growth and electrification targets underpin long-run demand.
Europe maintained 22% share in 2025. Scandinavia, the United Kingdom, and Italy achieved near-universal penetration, while Germany, France, and Spain are midway through compliance with the Energy Efficiency Directive. Eastern European cohesion funds propelled Poland and Romania into tenders during 2024-2025. North America captured roughly 18%, with the United States approaching saturation in investor-owned utility territories but lagging in municipal and cooperative systems. Canada finished provincial roll-outs by 2024, whereas Mexico's Comision Federal de Electricidad targets 10 Million meters by 2027. South America and the Middle East each accounted for 5%-7% of revenues, with Brazil, Argentina, Saudi Arabia, and the United Arab Emirates driving localized initiatives.
- Landis+Gyr Group AG
- Itron Inc.
- Sensus USA Inc. (Xylem Inc.)
- Honeywell (Elster Group)
- Kamstrup A/S
- Siemens AG
- Schneider Electric SE
- Huawei Technologies Co. Ltd.
- General Electric Co.
- Aclara Technologies LLC (Hubbell)
- EDMI Limited (Osaki Electric)
- Apator SA
- Arad Group
- Badger Meter Inc.
- Diehl Metering GmbH
- Hexing Electrical Co. Ltd.
- Holley Technology Ltd.
- Jiangsu Linyang Energy Co.
- Wasion Holdings Ltd.
- Zenner International GmbH
- Neptune Technology Group (Roper)
- Baylan Water Meters
- ZIV Automation
- Pietro Fiorentini SpA
- ADD GRUP
- Yazaki Corporation
Additional Benefits:
- The market estimate (ME) sheet in Excel format
- 3 months of analyst support
TABLE OF CONTENTS
1 INTRODUCTION
- 1.1 Study Assumptions and Market Definition
- 1.2 Scope of the Study
2 RESEARCH METHODOLOGY
3 EXECUTIVE SUMMARY
4 MARKET LANDSCAPE
- 4.1 Market Overview
- 4.2 Market Drivers
- 4.2.1 Government Mandates for Nationwide Roll-outs
- 4.2.2 Utility Efficiency and Non-Technical-Loss Reduction
- 4.2.3 Grid Modernisation and DER Integration Programs
- 4.2.4 Smart-City / IoT Infrastructure Expansion
- 4.2.5 ESG-Linked Financing Requiring Digital Metering
- 4.2.6 AI-Ready Edge Analytics Unlocking New Revenue Streams
- 4.3 Market Restraints
- 4.3.1 High Upfront CAPEX and Long Payback Cycles
- 4.3.2 Cyber-Security and Data-Privacy Risks
- 4.3.3 Legacy Grid and IT Integration Complexity
- 4.3.4 Semiconductor Supply-Chain Volatility
- 4.4 Industry Value / Supply-Chain Analysis
- 4.5 Regulatory Landscape
- 4.6 Technological Outlook
- 4.7 Porter's Five Forces Analysis
- 4.7.1 Bargaining Power of Suppliers
- 4.7.2 Bargaining Power of Buyers
- 4.7.3 Threat of New Entrants
- 4.7.4 Threat of Substitute Products
- 4.7.5 Degree of Competition
- 4.8 Impact of Macroeconomic Factors on the Market
5 MARKET SIZE AND GROWTH FORECASTS (VOLUME)
- 5.1 By Product Type
- 5.1.1 Smart Electricity Meters
- 5.1.2 Smart Gas Meters
- 5.1.3 Smart Water Meters
- 5.2 By Communication Technology
- 5.2.1 RF Mesh
- 5.2.2 Power-Line Communication (PLC)
- 5.2.3 Cellular (2G-5G / NB-IoT / LTE-M)
- 5.2.4 Low-Power Wide Area (LoRaWAN / Sigfox / Wize)
- 5.3 By Component
- 5.3.1 Hardware
- 5.3.2 Software
- 5.3.3 Services
- 5.4 By End-User
- 5.4.1 Residential
- 5.4.2 Commercial
- 5.4.3 Industrial and Utilities
- 5.5 By Geography
- 5.5.1 North America
- 5.5.1.1 United States
- 5.5.1.2 Canada
- 5.5.1.3 Mexico
- 5.5.2 South America
- 5.5.2.1 Brazil
- 5.5.2.2 Argentina
- 5.5.2.3 Rest of South America
- 5.5.3 Europe
- 5.5.3.1 Germany
- 5.5.3.2 United Kingdom
- 5.5.3.3 France
- 5.5.3.4 Italy
- 5.5.3.5 Spain
- 5.5.3.6 Russia
- 5.5.3.7 Rest of Europe
- 5.5.4 Asia Pacific
- 5.5.4.1 China
- 5.5.4.2 Japan
- 5.5.4.3 India
- 5.5.4.4 South Korea
- 5.5.4.5 Australia and New Zealand
- 5.5.4.6 Southeast Asia
- 5.5.4.7 Rest of Asia Pacific
- 5.5.5 Middle East
- 5.5.5.1 Saudi Arabia
- 5.5.5.2 United Arab Emirates
- 5.5.5.3 Turkey
- 5.5.5.4 Rest of Middle East
- 5.5.6 Africa
- 5.5.6.1 South Africa
- 5.5.6.2 Nigeria
- 5.5.6.3 Egypt
- 5.5.6.4 Rest of Africa
- 5.5.1 North America
6 COMPETITIVE LANDSCAPE
- 6.1 Market Concentration
- 6.2 Strategic Moves
- 6.3 Market Share Analysis
- 6.4 Company Profiles (includes Global level Overview, Market level overview, Core Segments, Financials as available, Strategic Information, Market Rank/Share for key companies, Products and Services, and Recent Developments)
- 6.4.1 Landis+Gyr Group AG
- 6.4.2 Itron Inc.
- 6.4.3 Sensus USA Inc. (Xylem Inc.)
- 6.4.4 Honeywell (Elster Group)
- 6.4.5 Kamstrup A/S
- 6.4.6 Siemens AG
- 6.4.7 Schneider Electric SE
- 6.4.8 Huawei Technologies Co. Ltd.
- 6.4.9 General Electric Co.
- 6.4.10 Aclara Technologies LLC (Hubbell)
- 6.4.11 EDMI Limited (Osaki Electric)
- 6.4.12 Apator SA
- 6.4.13 Arad Group
- 6.4.14 Badger Meter Inc.
- 6.4.15 Diehl Metering GmbH
- 6.4.16 Hexing Electrical Co. Ltd.
- 6.4.17 Holley Technology Ltd.
- 6.4.18 Jiangsu Linyang Energy Co.
- 6.4.19 Wasion Holdings Ltd.
- 6.4.20 Zenner International GmbH
- 6.4.21 Neptune Technology Group (Roper)
- 6.4.22 Baylan Water Meters
- 6.4.23 ZIV Automation
- 6.4.24 Pietro Fiorentini SpA
- 6.4.25 ADD GRUP
- 6.4.26 Yazaki Corporation
7 MARKET OPPORTUNITIES AND FUTURE OUTLOOK
- 7.1 White-Space and Unmet-Need Assessment

