
PUBLISHER: Mordor Intelligence | PRODUCT CODE: 2061614

PUBLISHER: Mordor Intelligence | PRODUCT CODE: 2061614
Recreational Vehicle - Market Share Analysis, Industry Trends & Statistics, Growth Forecasts (2026 - 2031)
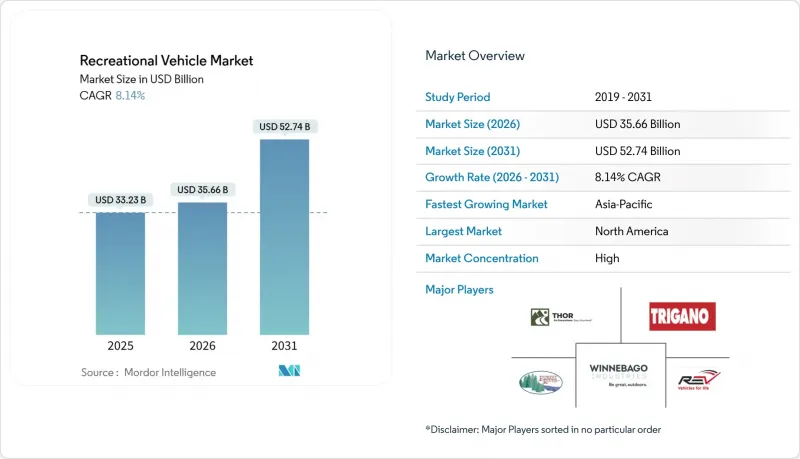
According to Mordor Intelligence, the recreational vehicle market size was valued at USD 33.23 billion in 2025 and estimated to grow from USD 35.66 billion in 2026 to reach USD 52.74 billion by 2031, at a CAGR of 8.14% during the forecast period (2026-2031).
This report is Segmented by Type (Towable Recreational Vehicles and Motorhomes), Application (Domestic/Personal Use and Commercial), Propulsion (Internal Combustion Engine, Hybrid, and Battery Electric Recreational Vehicles), Length Category (Below 20 Feet, 20 To 30 Feet, and Above 30 Feet), and Geography. The Market Forecasts are Provided in Terms of Value (USD) and Volume (Units).
Global Recreational Vehicle Market Trends and Insights
Remote-Work Culture Sustaining Mobile Living Demand
In the recreational vehicle market, Most of the campers worked from campsites in 2025, indicating that recreational vehicles (RVs) are now doubling as hybrid offices. Younger owners gravitate toward Class B vans outfitted with LTE routers, solar arrays, and fold-down desks, prompting OEMs to add Starlink-ready mounts and 120-volt inverters as standard features on 2025 models. Campground operators responded by upgrading electrical pedestals to 50-amp service and installing fiber-optic Wi-Fi; KOA registered a 95% franchise-renewal rate as park owners reinvested to capture extended-stay bookings. The shift blurs the boundary between leisure and residential real estate, creating dependable off-season occupancy and elevating ancillary revenue from long-term site leases. However, unresolved tax guidance on depreciation deductions for mobile offices creates compliance risk that could temper adoption.
Domestic Tourism Boom and Campground Infrastructure Growth
Border closures earlier in the decade redirected leisure spending to domestic road trips, and the habit persisted as airlines reinstated fuel surcharges in 2025. Australia logged 15.3 million caravan and camping trips in 2023, generating AUD 14.3 billion (USD 9.5 billion) in spending. In the United States, state park systems collectively earmarked more than USD 200 million in 2024 for electrification and wastewater hookups, increasing suitability for larger motorhomes. Private-equity groups such as Sun Communities acquired 12 RV-resort portfolios, standardized amenities, and lifted nightly rates 8%-12% in high-demand corridors. The recreational vehicle market benefits directly from the capacity build-out, yet peak-season occupancy exceeding 95% at flagship parks funnels spontaneous travelers toward dispersed public lands where services are minimal and regulatory enforcement is inconsistent. Rising fees could spark affordability concerns for entry-level campers if wage growth lags.
High Interest-Rate Environment Inflating Loan Costs
Credit remains tight even as rates ease, curbing demand in price-sensitive towable categories. The Federal Reserve held its target rate at 5.25%-5.50% throughout 2025, pushing RV loan APRs into a 9.5%-13.5% band, adding USD 150-USD 250 to monthly payments on a USD 50,000 towable financed over 15 years. Subprime borrowers faced rates near 20%, effectively excluding them from the new-unit market and swelling demand for aging used inventory. Winnebago's Q1 FY 2025 revenue slid 19.5% to USD 550.6 million, with floorplan interest expense squeezing dealer orders. Lenders raised minimum down payments to 15%, further dampening first-time buyer traffic. Monetary easing would provide an immediate volume catalyst, but rate volatility will keep affordability center stage.
Other drivers and restraints analyzed in the detailed report include:
- Expansion of RV Financing and Peer-To-Peer Rental Platforms
- OEM Electrification Road-Maps For Zero-Emission RV Lines
- Oversupply of Used RVs Driving Price Depreciation
For complete list of drivers and restraints, kindly check the Table Of Contents.
Segment Analysis
Towable recreational vehicles accounted for 62.44% of 2025 shipments within the recreational vehicle market, buoyed by lower entry prices and compatibility with existing pickups. Travel trailers span 16- to 35-foot floorplans, serving everyone from minimalist couples to large families, whereas fifth-wheels attract long-haul travelers who value gooseneck stability. Folding campers and truck-bed units address garage-height or off-road constraints, broadening demographic reach.
Motorhomes are projected to outpace towables at a 9.26% CAGR through 2031, powered by compact Class B vans on Mercedes Sprinter and Ford Transit chassis that resonate with younger buyers prioritizing drivability. Folding campers cater to storage-challenged owners, but competition from micro motorhomes dampens growth prospects. THOR's move to consolidate Entegra Coach's diesel-pusher production under Tiffin enhances scale efficiencies and signals continued rationalization in high-price motorhome lines. Class A luxury coaches maintain premium status but face volume pressure from high fuel costs and price tags north of USD 200,000. Class C rigs offer balanced handling and interior space, appealing to young families. Electrification and hybridization will intensify competition as OEMs repurpose delivery-van platforms into human-habitat configurations, expanding the recreational vehicle market footprint.
Domestic ownership represented 70.63% of 2025 demand, reflecting weekend camping, extended road trips, and a growing cohort of full-timers estimated at 1 million United States households. Retirees gravitate toward Class A rigs for seasonal migrations, while working families choose towables that can be parked seasonally. Fifty-four percent of remote-work households perform their jobs from an RV, blending leisure and livelihood.
Commercial deployments, advancing at an 8.54% CAGR, leverage peer-to-peer rentals, fleet hospitality at events, and mobile command centers. Cruise America and El Monte operate roughly 8,000 traditional rentals, but platform listings exceed 50,000, dispersing supply to secondary markets. Corporate users retrofit luxury coaches as boardrooms on wheels, commanding daily rates above USD 1,000. Rising commercial utilization diversifies revenue and insulates the recreational vehicle market from pure retail cycles.
Geography Analysis
North America commanded a dominant 59.52% share of the global RV revenue in 2025, buoyed by 11.2 million RV-owning households in the United States and a robust network of 2,500 dealers. However, Thor Industries faced a setback, with North American sales dipping 13.4% year-over-year to USD 1.68 billion in Q1 FY 2026, primarily due to high APRs that tempered dealer orders. While dealer inventory levels shifted, other dynamics played out: used-unit depreciation and municipal parking bans in California nudged travelers towards fee-based campsites, much to the delight of campground operators. Canada's advantage lies in its closeness to the United States supply chains and the allure of currency-driven cross-border purchases. In contrast, Mexico's RV market remains a niche player, hampered by a sparse campground density.
Asia-Pacific is the fastest-growing territory at a projected 9.54% CAGR, led by Australia's 908,513 registered caravans and motorhomes, up 21% since 2019. The country manufactured 25,185 units in 2024 but imported nearly 20,000, 95% from Chinese factories that undercut local pricing by USD 8,000-USD 12,000. China sold 14,365 units, becoming the fourth-largest national market despite infrastructure shortfalls-Guangdong hosts fewer than 20 dedicated campsites. Japanese and South Korean demand centers on micro campers based on the Toyota HiAce and Hyundai Staria platforms that navigate narrow urban streets.
Europe's entrenched players-Trigano, Knaus Tabbert, and Hymer-face a cautious consumer backdrop: Trigano's half-year FY 2024/25 revenue slipped 5.9% to EUR 1.56 billion (USD 1.69 billion). Germany's emissions zones and elevated diesel prices weigh on motorhome appetite, while the United Kingdom digests post-Brexit tariff friction. Southern markets such as Spain and Portugal enjoy milder climates, sustaining off-season utilization. Eastern Europe represents untapped potential but requires campground investment and financing access to unlock demand. Collectively, Europe contributes roughly one-quarter of the recreational vehicle market, though growth lags North America and Asia-Pacific.
- Thor Industries Inc.
- Forest River Inc.
- Winnebago Industries Inc.
- REV Group Inc.
- Trigano SA
- Knaus Tabbert AG
- Jayco Inc.
- Grand Design RV Co.
- Keystone RV Co.
- Airstream Inc.
- Hymer GmbH
- Burstner GmbH
- Dethleffs GmbH
- Hobby-Wohnwagenwerk
- Adria Mobil d.o.o
- Triple E Recreational Vehicles
- Tiffin Motorhomes Inc.
- Coachmen RV
- Gulf Stream Coach Inc.
- Leisure Travel Vans
Additional Benefits:
- The market estimate (ME) sheet in Excel format
- 3 months of analyst support
TABLE OF CONTENTS
1 Introduction
- 1.1 Study Assumptions and Market Definition
- 1.2 Scope of the Study
2 Research Methodology
3 Executive Summary
4 Market Landscape
- 4.1 Market Overview
- 4.2 Market Drivers
- 4.2.1 Remote-Work Culture Sustaining Mobile Living Demand
- 4.2.2 Domestic Tourism Boom and Campground Infrastructure Growth
- 4.2.3 Expansion of RV Financing and Peer-to-Peer Rental Platforms
- 4.2.4 OEM Electrification Road-Maps for Zero-Emission RV Lines
- 4.2.5 OTA Connectivity Unlocking Subscription Revenue Streams
- 4.2.6 Direct-to-Consumer Online Sales Shrinking Dealer Margins
- 4.3 Market Restraints
- 4.3.1 High Interest-Rate Environment Inflating Loan Costs
- 4.3.2 Persistent Chassis and Component Supply Bottlenecks
- 4.3.3 Oversupply of Used RVs Driving Price Depreciation
- 4.3.4 Municipal Crack-Downs On Urban Overnight Parking
- 4.4 Value/Supply-Chain Analysis
- 4.5 Regulatory Landscape
- 4.6 Technological Outlook
- 4.7 Porter's Five Forces Analysis
- 4.7.1 Bargaining Power of Suppliers
- 4.7.2 Bargaining Power of Buyers
- 4.7.3 Threat of New Entrants
- 4.7.4 Threat of Substitutes
- 4.7.5 Competitive Rivalry
5 Market Size and Growth Forecasts (Value (USD) and Volume (Units))
- 5.1 By Type
- 5.1.1 Towable RVs
- 5.1.1.1 Travel Trailers
- 5.1.1.2 Fifth-Wheel Trailers
- 5.1.1.3 Folding Camp Trailers
- 5.1.1.4 Truck Campers
- 5.1.2 Motorhomes
- 5.1.2.1 Class A
- 5.1.2.2 Class B (Camper Vans)
- 5.1.2.3 Class C
- 5.1.1 Towable RVs
- 5.2 By Application
- 5.2.1 Domestic/Personal Use
- 5.2.2 Commercial (Rental Fleets, Mobile Offices, Events)
- 5.3 By Propulsion
- 5.3.1 Internal-Combustion Engine (ICE)
- 5.3.2 Hybrid
- 5.3.3 Battery-Electric RVs
- 5.4 By Length Category
- 5.4.1 Below 20 feet
- 5.4.2 20 to 30 feet
- 5.4.3 Above 30 feet
- 5.5 By Geography
- 5.5.1 North America
- 5.5.1.1 United States
- 5.5.1.2 Canada
- 5.5.1.3 Rest of North America
- 5.5.2 South America
- 5.5.2.1 Brazil
- 5.5.2.2 Argentina
- 5.5.2.3 Rest of South America
- 5.5.3 Europe
- 5.5.3.1 Germany
- 5.5.3.2 United Kingdom
- 5.5.3.3 France
- 5.5.3.4 Spain
- 5.5.3.5 Italy
- 5.5.3.6 Netherlands
- 5.5.3.7 Rest of Europe
- 5.5.4 Asia-Pacific
- 5.5.4.1 China
- 5.5.4.2 Japan
- 5.5.4.3 India
- 5.5.4.4 South Korea
- 5.5.4.5 Australia and New Zealand
- 5.5.4.6 Rest of Asia-Pacific
- 5.5.5 Middle East and Africa
- 5.5.5.1 GCC
- 5.5.5.2 Turkey
- 5.5.5.3 South Africa
- 5.5.5.4 Nigeria
- 5.5.5.5 Kenya
- 5.5.5.6 Rest of Middle East and Africa
- 5.5.1 North America
6 Competitive Landscape
- 6.1 Market Concentration
- 6.2 Strategic Moves
- 6.3 Market Share Analysis
- 6.4 Company Profiles (Includes Global level Overview, Market level Overview, Core Segments, Financials as available, Strategic Information, Market Rank/Share for key companies, Products and Services, Recent Developments)
- 6.4.1 Thor Industries Inc.
- 6.4.2 Forest River Inc.
- 6.4.3 Winnebago Industries Inc.
- 6.4.4 REV Group Inc.
- 6.4.5 Trigano SA
- 6.4.6 Knaus Tabbert AG
- 6.4.7 Jayco Inc.
- 6.4.8 Grand Design RV Co.
- 6.4.9 Keystone RV Co.
- 6.4.10 Airstream Inc.
- 6.4.11 Hymer GmbH
- 6.4.12 Burstner GmbH
- 6.4.13 Dethleffs GmbH
- 6.4.14 Hobby-Wohnwagenwerk
- 6.4.15 Adria Mobil d.o.o
- 6.4.16 Triple E Recreational Vehicles
- 6.4.17 Tiffin Motorhomes Inc.
- 6.4.18 Coachmen RV
- 6.4.19 Gulf Stream Coach Inc.
- 6.4.20 Leisure Travel Vans
7 Market Opportunities and Future Outlook

