
PUBLISHER: Mordor Intelligence | PRODUCT CODE: 2061615

PUBLISHER: Mordor Intelligence | PRODUCT CODE: 2061615
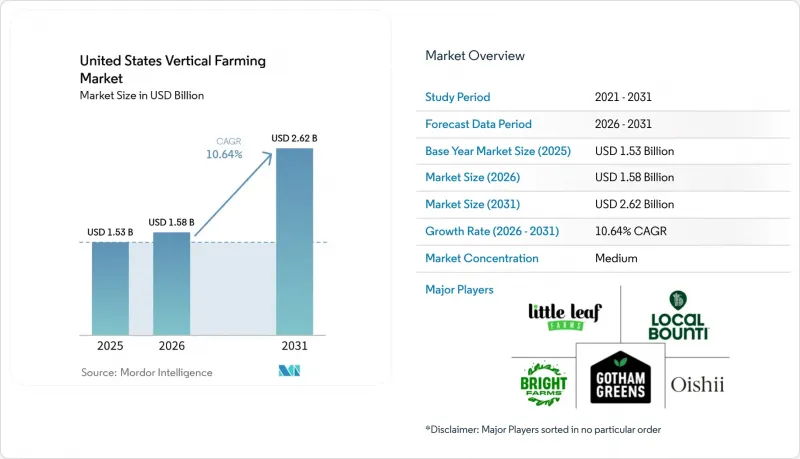
United States Vertical Farming - Market Share Analysis, Industry Trends & Statistics, Growth Forecasts (2026 - 2031)
According to Mordor Intelligence, the united states vertical farming market size was valued at USD 1.5 billion in 2025 and is estimated to grow from USD 1.6 billion in 2026 to reach USD 2.6 billion by 2031, at a CAGR of 10.6% during the forecast period 2026-2031.
This report is Segmented by Growth Mechanism (Hydroponics, Aeroponics, and Aquaponics), by Structure (Building-Based, Warehouse, and Container), by Crop Type (Leafy Greens, Herbs, Microgreens, and More), by Component (Hardware, Software, and Services), and by End User (Retail and Supermarkets, Foodservice, and More). The Market Forecasts are Provided in Terms of Value (USD).
United States Vertical Farming Market Trends and Insights
Demand for Local Pesticide-Free Greens
Retail demand is anchoring the United States vertical farming market, as major grocery chains increasingly treat pesticide-free produce as a procurement standard. Indoor farms consistently meet zero-pesticide and no-herbicide requirements, outperforming field growers and many greenhouse suppliers across seasons. This alignment with retail expectations is further supported by federal initiatives, such as the USDA's January 2025 announcement of USD 14.4 million in new Urban Agriculture and Innovative Production grants, bringing total commitments since 2020 to USD 53.7 million. These developments strengthen contract visibility, retailer relationships, and pricing discipline in packaged salads and fresh-cut categories. By reducing the risk that indoor greens are treated as discretionary products during economic downturns, the market is shifting its focus to retail category management and supply assurance. This interconnected demand pattern underscores the United States vertical farming market's growing reliance on stable retail partnerships rather than consumer novelty preferences.
Food-Mile Reduction and Same-Day Freshness
Shorter delivery distances are driving efficiency in the United States vertical farming market by addressing the significant shelf-life losses leafy greens face during long cross-country transit. Conventional produce from California and Arizona often takes 4 to 6 days to reach eastern retail networks, leaving limited time for store handling and consumer purchase. In contrast, indoor farms within 200 miles of major cities can deliver produce within 24 hours of harvest, extending retail shelf life by 5 to 7 days. A September 2025 study by Wang and coauthors highlighted that proximity sourcing reduced postharvest respiration losses by 18% to 22%, directly improving retailer margins and reducing markdowns. This shift underscores why same-day freshness is evolving from a marketing message to a contractual standard in urban distribution corridors, solidifying the case for regional indoor farming.
Power Intensity and Electricity-Price Volatility Pressure Margins
Electricity is a major cost driver for the United States vertical farming market due to the reliance on energy-intensive systems like lighting, climate control, and dehumidification. In 2024, Kaiser and coauthors reported that electricity constitutes 20% to 40% of production costs, with lighting alone consuming 60% to 85% of total electricity. AGEYE's 2025 findings showed that pre-build financial models often underestimate HVAC and dehumidification costs by 30% to 50%, leading to weaker cost assumptions. A 2026 study in Nature Communications found that most vertical farms exceed the energy-intensity threshold for carbon-competitive positioning against traditional imports. While dynamic lighting can cut electricity costs by 12%, retrofitting older facilities is often unaffordable. This leaves the market vulnerable to tariff volatility, particularly in the Midwest and Northeast, highlighting the urgent need for renewable energy adoption, storage systems, and efficient technologies to stabilize costs and enhance competitiveness.
Other drivers and restraints analyzed in the detailed report include:
- Water-Efficient Production under Western Drought Pressure
- AI Vision, Pollination, and Crop Recipes Enable Premium Fruit Crops
- Post-Bankruptcy Financing Gap Raises Cost of Capital
For complete list of drivers and restraints, kindly check the Table Of Contents.
Segment Analysis
Hydroponics dominated the United States vertical farming market with a 56.8% share in 2025, driven by its compatibility with leafy greens, established nutrient systems, and ease of integration into existing indoor farm layouts. Its ability to deliver predictable outputs and standardized crop cycles aligns with retailer demand for crops like lettuce and spinach, which remain the top commercial products. However, the widespread adoption of hydroponics has reduced product differentiation, making operational scale, execution, and customer access more critical for success.
Aeroponics, with a projected 16% CAGR during 2026-2031, is emerging as the fastest-growing mechanism due to its efficient water usage, 70% to 95% less than hydroponics, and enhanced root-zone oxygenation, which benefits high-value, water-sensitive crops. Innovations like Local Bounti's AI-assisted hybrid system, patented in February 2026, highlight the increasing flexibility of growth methods as operators optimize throughput. While aquaponics remains a niche due to its operational complexity in managing both plant and fish biology, it serves specialized markets like institutional and pharmaceutical channels, where traceability and closed-loop production add value. Together, these mechanisms reflect a market evolving towards efficiency, innovation, and targeted applications to meet diverse demands.
Building-based farms accounted for 68.6% of the 2025 market value, making them the largest structure type in the United States vertical farming market. Their ability to repurpose existing warehouse and industrial spaces for high-volume production, in addition to the dense multi-tier layouts and tighter climate control, ensures higher harvest volumes. These advantages are critical for meeting national and regional retail contracts, and the scalability of building-based formats allows operators to spread fixed costs over greater output, solidifying their central role in the market.
Meanwhile, shipping-container farms, with a projected CAGR of 12.2% during 2026-2031, are emerging as the fastest-growing structure type. Their modular and rapid-deployment capabilities make them ideal for food deserts, military locations, and institutional campuses where permanent construction is less practical. For instance, Opollo Farm's 2025 automated cube deployment in Phoenix demonstrated how container systems can address labor and space constraints through compact, automated solutions. Warehouse-based farms, positioned between these two formats, offer more cultivation volume than containers but lower build intensity compared to purpose-designed multi-level buildings. Together, these structure types reflect a market balancing large regional hubs with smaller, modular units, driving the evolution of the United States vertical farming market toward diverse and adaptable solutions.
List of Companies Covered in this Report:
- Little Leaf Farms, LLC
- Gotham Greens Holdings, LLC
- BrightFarms Inc. (Cox Enterprises, Inc.)
- Oishii Farm Corporation
- Local Bounti Corporation
- Plenty Unlimited Inc.
- AeroFarms, Inc.
- 80 Acres Farms, Inc.
- Square Roots, Inc.
- Farm.One, Inc.
- American Hydroponics, Inc.
- Argus Control Systems Limited
- Priva Holding B.V.
- Netafim Ltd. (Orbia Advance Corporation, S.A.B. de C.V.)
- Fluence Bioengineering, Inc. (ams-OSRAM AG)
Additional Benefits:
- The market estimate (ME) sheet in Excel format
- 3 months of analyst support
TABLE OF CONTENTS
1 Introduction
- 1.1 Study Assumptions and Market Definition
- 1.2 Scope of the Study
2 Research Methodology
3 Executive Summary
4 Market Landscape
- 4.1 Market Overview
- 4.2 Market Drivers
- 4.2.1 Demand for local pesticide-free greens
- 4.2.2 Food-mile reduction and same-day freshness
- 4.2.3 Water-efficient production under western drought pressure
- 4.2.4 Retailer demand for year-round supply resilience
- 4.2.5 Renewable power and microgrid contracting improves economics
- 4.2.6 AI vision, pollination, and crop recipes enable premium fruit crops
- 4.3 Market Restraints
- 4.3.1 Crop profitability remains concentrated in leafy greens and herbs
- 4.3.2 Power intensity and electricity-price volatility pressure margins
- 4.3.3 Post-bankruptcy financing gap raises cost of capital
- 4.3.4 State and local zoning, permitting, and interconnection complexity
- 4.4 Regulatory Landscape
- 4.5 Technological Outlook
- 4.6 Porter's Five Forces Analysis
- 4.6.1 Bargaining Power of Suppliers
- 4.6.2 Bargaining Power of Buyers
- 4.6.3 Threat of New Entrants
- 4.6.4 Threat of Substitutes
- 4.6.5 Intensity of Competitive Rivalry
5 Market Size and Growth Forecasts (Value)
- 5.1 By Growth Mechanism
- 5.1.1 Hydroponics
- 5.1.2 Aeroponics
- 5.1.3 Aquaponics
- 5.2 By Structure
- 5.2.1 Building-based Vertical Farms
- 5.2.2 Warehouse-based Vertical Farms
- 5.2.3 Shipping-Container Vertical Farms
- 5.3 By Crop Type
- 5.3.1 Leafy Greens
- 5.3.2 Herbs
- 5.3.3 Microgreens
- 5.3.4 Fruits and Berries
- 5.3.5 Flowers and Ornamentals
- 5.4 By Component
- 5.4.1 Hardware
- 5.4.1.1 Lighting Systems
- 5.4.1.2 HVAC and Climate Control
- 5.4.1.3 Sensors and Monitoring
- 5.4.1.4 Irrigation and Nutrient Delivery
- 5.4.1.5 Racks, Trays, and Conveyance
- 5.4.1.6 Power and Backup Systems
- 5.4.2 Software
- 5.4.2.1 Farm Operating Systems
- 5.4.2.2 AI and Computer Vision
- 5.4.2.3 Workflow, ERP, and Traceability
- 5.4.3 Services
- 5.4.3.1 Design and Integration
- 5.4.3.2 Maintenance and Agronomy Support
- 5.4.3.3 Managed Operations
- 5.4.1 Hardware
- 5.5 By End User
- 5.5.1 Retail and Supermarkets
- 5.5.2 Foodservice
- 5.5.3 Direct-to-Consumer and E-commerce
- 5.5.4 Institutional and Government
- 5.5.5 Pharmaceutical and Cosmetic Ingredient Buyers
6 Competitive Landscape
- 6.1 Market Concentration
- 6.2 Strategic Moves
- 6.3 Market Share Analysis
- 6.4 Company Profiles (Includes Global Level Overview, Market Level Overview, Core Segments, Financials as Available, Strategic Information, Market Rank/Share for Key Companies, Products and Services, and Recent Developments)
- 6.4.1 Little Leaf Farms, LLC
- 6.4.2 Gotham Greens Holdings, LLC
- 6.4.3 BrightFarms Inc. (Cox Enterprises, Inc.)
- 6.4.4 Oishii Farm Corporation
- 6.4.5 Local Bounti Corporation
- 6.4.6 Plenty Unlimited Inc.
- 6.4.7 AeroFarms, Inc.
- 6.4.8 80 Acres Farms, Inc.
- 6.4.9 Square Roots, Inc.
- 6.4.10 Farm.One, Inc.
- 6.4.11 American Hydroponics, Inc.
- 6.4.12 Argus Control Systems Limited
- 6.4.13 Priva Holding B.V.
- 6.4.14 Netafim Ltd. (Orbia Advance Corporation, S.A.B. de C.V.)
- 6.4.15 Fluence Bioengineering, Inc. (ams-OSRAM AG)
7 Market Opportunities and Future Outlook

