
PUBLISHER: Mordor Intelligence | PRODUCT CODE: 2061667

PUBLISHER: Mordor Intelligence | PRODUCT CODE: 2061667
Formulation Additive - Market Share Analysis, Industry Trends & Statistics, Growth Forecasts (2026 - 2031)
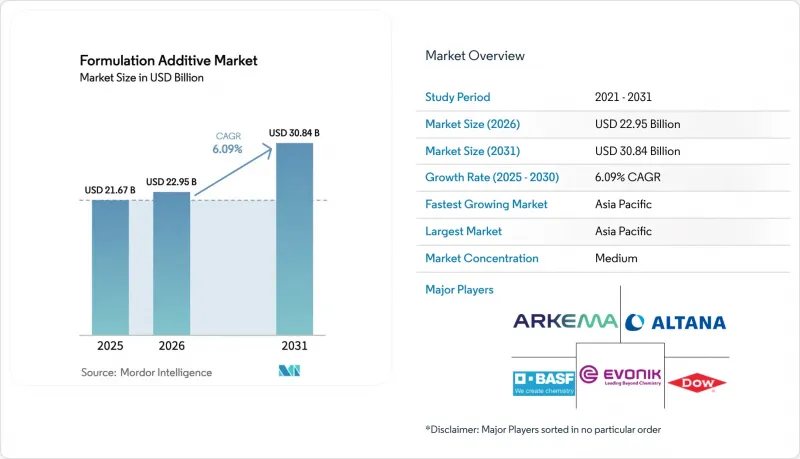
According to Mordor Intelligence, the formulation additive market size is projected to expand from USD 21.67 billion in 2025 and USD 22.95 billion in 2026 to USD 30.84 billion by 2031, registering a CAGR of 6.09% between 2026 to 2031.
This report is Segmented by Additive Type (Defoamers, Rheology Modifiers, and More), End-Use Industry (Construction, Transportation, Automotive, Oil and Gas, and More), Formulation Technology (Water-Borne Systems, Solvent-Borne Systems, and More), and Geography (Asia-Pacific, North America, Europe, South America, and Middle-East and Africa). The Market Forecasts are Provided in Terms of Value (USD).
Global Formulation Additive Market Trends and Insights
Sustainability-Driven Switch to Low-VOC Water-Borne Coatings
Since 2020, water-borne coatings have surged to dominate a significant share of the global architectural paint volume. This evolution aligns with the heightened VOC limit regulations imposed by authorities in the European Union and California. In light of these changes, major manufacturers are transitioning from the use of traditional glycol ethers to bio-based coalescents and are increasingly adopting associative thickeners. These thickeners, which uphold viscosity without organic solvents, have led to a notable decrease in cradle-to-gate emissions when compared with solvent-borne alternatives. BASF has introduced rheology modifiers that replicate the anti-sag characteristics of alkyds, allowing specifiers to secure LEED v4.1 credits while maintaining high application quality. Meanwhile, platforms such as Benjamin Moore's Gennex, which feature zero-VOC colorants, are reducing pigment demand, resulting in tangible raw-material cost reductions. Furthermore, in both the United States and Europe, there is a discernible trend in public-sector procurement favoring products backed by third-party environmental declarations, accelerating changes in infrastructure projects.
Expansion of Infrastructure Spending in Emerging Economies
India, under its National Chemicals Policy, is targeting a substantial boost in domestic chemical production by 2030. The policy offers foreign investors an enticing decade-long tax holiday across 12 chosen investment zones. Meanwhile, in Indonesia, the Nusantara capital project is setting a benchmark. It requires all government buildings to use low-VOC coatings, thereby increasing the demand for water-borne dispersing agents and defoamers. Saudi Arabia's Public Investment Fund is making a major investment in the NEOM industrial zone, featuring an ethylene cracker that will cater to downstream additive units. This strategic move is expected to cut logistics costs for local formulators. In Vietnam, a recent amendment to the Construction Law mandates VOC testing for skyscraper projects, paving the way for a profitable market for compliant additives by 2028. In 2024, major multilateral lenders committed significant funds to enhance Southeast Asian infrastructure, with a notable emphasis on green-building agreements, highlighting a preference for water-borne and UV-curable solutions.
Stringent REACH and TSCA Re-Registration Costs
In 2025, the European Chemicals Agency added eight substances to its Candidate List. Manufacturers face high costs for high-volume substance dossiers, excluding the essential genotoxicity testing. In the United States, the EPA requires manufacturers to report exposure data for thousands of chemicals every four years, imposing substantial fines for non-compliance. Evonik discontinued several surfactant SKUs after internal models projected a negative net present value, taking future authorization fees into account. Mid-sized firms, particularly those with product line portfolios below a certain threshold, are disproportionately burdened by these compliance costs.
Other drivers and restraints analyzed in the detailed report include:
- Rapid Growth of High-Performance Lightweight Composites
- E-Mobility Demand for Thermal-Management Fluids and Additives
- Rising PFAS-Free Specification Bans
For complete list of drivers and restraints, kindly check the Table Of Contents.
Segment Analysis
In 2025, dispersing agents accounted for 33.71% of the revenue, highlighting their pivotal role in stabilizing pigments and fillers across various systems, including water-borne, solvent-borne, and UV. BASF's DISPERBYK-2150, leveraging a polyurethane backbone, curtailed the demand for TiO2, leading to cost efficiencies in paint batches.
Rheology modifiers are projected to grow at a 6.61% CAGR during the forecast period of 2026-2031, driven by the demand for shear-thinning 3D-print mortars and anti-sag vertical coatings. Associative thickeners, now adept at resisting viscosity drift even in tropical conditions, have broadened the formulation additive market's reach beyond temperate zones. Defoamers have secured a significant market share; Evonik's silicone-free introduction not only meets EU Ecolabel standards but also addresses crater-formation issues that previously challenged satin finishes. Surfactant-based wetting agents met the stringent ionic contamination standards of electronics, while a combination of coupling agents, adhesion promoters, and UV stabilizers made notable contributions to specialized niches.
Geography Analysis
In 2025, the Asia-Pacific region accounted for 42.23% of the global revenue and is projected to grow at a 6.99% CAGR during the forecast period of 2026-2031. India's ambitious chemical roadmap and China's strategic investments in specialty parks in Jiangsu and Shandong are the primary drivers of this growth. Regional producers are poised to increase their stake in the formulation additive market, bolstered by SABIC's investment in a Fujian complex, now utilizing EVA feedstock for adhesive additives. Furthermore, Japan's subsidy initiative is enhancing domestic production of semiconductor-grade dispersants.
North America, with a significant market share in 2025, is reaping benefits from IRA-driven electrification and Dow's bio-ethylene expansion in Texas. This expansion plays a crucial role in supplying low-carbon acrylate monomers, vital for rheology modifiers. The nearshoring boom in Mexico has spurred the creation of numerous factory jobs, escalating the demand for conformal coatings and thermal interface materials. These materials heavily depend on surfactant and coupling-agent packages. The region's specialty additives production enjoys a cushion from abundant shale gas, a privilege not extended to Europe, which grapples with import reliance and feedstock volatility.
Europe is steering its market dynamics in line with the EU Green Deal's Fit for 55 targets. These targets are steering formulators towards sustainable choices like water-borne and UV systems. Germany is advancing with decarbonization grants, backing electrified crackers and bio-based pilots, paving the way for a market for green-label additives. South America is buoyed by Brazil's construction resurgence and Argentina's rising lithium sector, both showing interest in corrosion-resistant pond coatings. Meanwhile, the Middle-East and Africa are leveraging low-cost ethane feedstock, though they grapple with fragmented regulations that slow the adoption of specialty grades.
- Altana (BYK)
- Arkema
- Arxada
- BASF
- Cabot Corporation
- Clariant
- Dow
- Eastman Chemical Company
- Evonik Industries AG
- Honeywell International Inc.
- Huntsman International LLC
- LANXESS
- Lubrizol
- Momentive
- Munzing Chemie GmbH
- Wacker Chemie AG
Additional Benefits:
- The market estimate (ME) sheet in Excel format
- 3 months of analyst support
TABLE OF CONTENTS
1 Introduction
- 1.1 Study Assumptions and Market Definition
- 1.2 Scope of the Study
2 Research Methodology
3 Executive Summary
4 Market Landscape
- 4.1 Market Overview
- 4.2 Market Drivers
- 4.2.1 Sustainability-driven switch to low-VOC water-borne coatings
- 4.2.2 Expansion of infrastructure spending in emerging economies
- 4.2.3 Rapid growth of high-performance lightweight composites
- 4.2.4 E-mobility demand for thermal-management fluids and additives
- 4.2.5 OEM push for sensor-friendly ultra-low-dielectric additives
- 4.3 Market Restraints
- 4.3.1 Volatile petrochemical feedstock pricing
- 4.3.2 Stringent REACH and TSCA re-registration costs
- 4.3.3 Rising PFAS-free specification bans
- 4.4 Value Chain Analysis
- 4.5 Porter's Five Forces
- 4.5.1 Bargaining Power of Suppliers
- 4.5.2 Bargaining Power of Buyers
- 4.5.3 Threat of New Entrants
- 4.5.4 Threat of Substitute Products
- 4.5.5 Degree of Competition
5 Market Size and Growth Forecasts (Value)
- 5.1 By Additive Type
- 5.1.1 Defoamers
- 5.1.2 Rheology Modifiers
- 5.1.3 Dispersing Agents
- 5.2 By End-use Industry
- 5.2.1 Construction
- 5.2.2 Transportation
- 5.2.3 Automotive
- 5.2.4 Oil and Gas
- 5.2.5 Food and Beverage
- 5.2.6 Electronics
- 5.2.7 Other End-user Industries
- 5.3 By Formulation Technology
- 5.3.1 Water-borne Systems
- 5.3.2 Solvent-borne Systems
- 5.3.3 Powder Coatings
- 5.3.4 UV/EB-curable Systems
- 5.4 By Geography
- 5.4.1 Asia-Pacific
- 5.4.1.1 China
- 5.4.1.2 Japan
- 5.4.1.3 India
- 5.4.1.4 South Korea
- 5.4.1.5 Rest of Asia-Pacific
- 5.4.2 North America
- 5.4.2.1 United States
- 5.4.2.2 Canada
- 5.4.2.3 Mexico
- 5.4.3 Europe
- 5.4.3.1 Germany
- 5.4.3.2 United Kingdom
- 5.4.3.3 France
- 5.4.3.4 Italy
- 5.4.3.5 Rest of Europe
- 5.4.4 South America
- 5.4.4.1 Brazil
- 5.4.4.2 Argentina
- 5.4.4.3 Rest of South America
- 5.4.5 Middle-East and Africa
- 5.4.5.1 Saudi Arabia
- 5.4.5.2 South Africa
- 5.4.5.3 Rest of Middle-East and Africa
- 5.4.1 Asia-Pacific
6 Competitive Landscape
- 6.1 Market Concentration
- 6.2 Strategic Moves
- 6.3 Market Share(%)/Ranking Analysis
- 6.4 Company Profiles (includes Global level Overview, Market level overview, Core Segments, Financials as available, Strategic Information, Products and Services, and Recent Developments)
- 6.4.1 Altana (BYK)
- 6.4.2 Arkema
- 6.4.3 Arxada
- 6.4.4 BASF
- 6.4.5 Cabot Corporation
- 6.4.6 Clariant
- 6.4.7 Dow
- 6.4.8 Eastman Chemical Company
- 6.4.9 Evonik Industries AG
- 6.4.10 Honeywell International Inc.
- 6.4.11 Huntsman International LLC
- 6.4.12 LANXESS
- 6.4.13 Lubrizol
- 6.4.14 Momentive
- 6.4.15 Munzing Chemie GmbH
- 6.4.16 Wacker Chemie AG
7 Market Opportunities and Future Outlook
- 7.1 White-space and Unmet-need Assessment
- 7.2 Advanced Computational Modeling and In-silico Simulations

