
PUBLISHER: Mordor Intelligence | PRODUCT CODE: 2061828

PUBLISHER: Mordor Intelligence | PRODUCT CODE: 2061828
Canned Tuna - Market Share Analysis, Industry Trends & Statistics, Growth Forecasts (2026 - 2031)
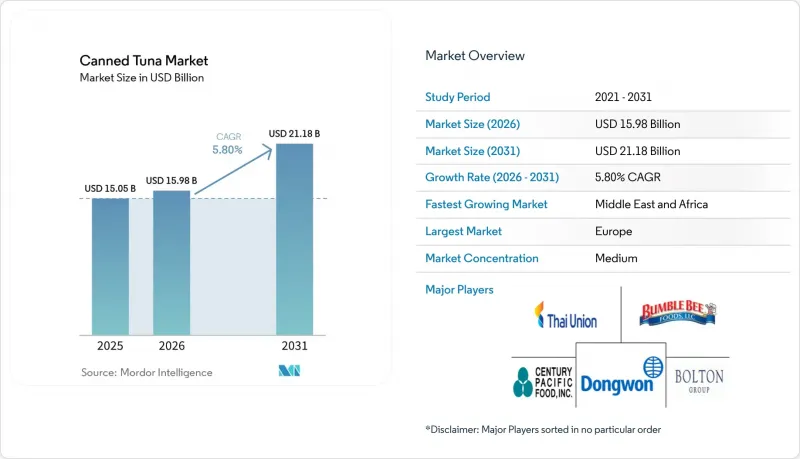
According to Mordor Intelligence, the canned tuna market size is projected to be USD 15.05 billion in 2025, USD 15.98 billion in 2026, and reach USD 21.18 billion by 2031, growing at a CAGR of 5.8% from 2026 to 2031.
This report is Segmented by Product Type (White Tuna and Light Tuna), Flavor (Flavored and Unflavored), Packaging Type (Metal Cans, Pouches, and Glass Jars), Distribution Channel (On-Trade and Off-Trade), and Geography (North America, Europe, Asia-Pacific, South America, and Middle East and Africa). The Market Forecasts are Provided in Terms of Value (USD).
Global Canned Tuna Market Trends and Insights
Convenience and ready-to-eat appeal
The convenience and ready-to-eat appeal of canned tuna is a major driver in the market, as consumers increasingly seek quick, nutritious meal solutions that fit busy lifestyles. Canned tuna requires no preparation, can be stored for long periods, and is easily incorporated into salads, sandwiches, and various dishes, making it a staple in both household and foodservice settings. Its portability and minimal need for refrigeration further enhance its attractiveness for on-the-go consumption, lunchboxes, and emergency food supplies. The rise in single-person households and urban living amplifies demand for ready-to-eat protein sources, while health-conscious consumers value canned tuna for its lean protein and omega-3 content. Additionally, manufacturers are innovating with flavored and pre-mixed options to cater to evolving tastes and convenience expectations. This trend is particularly evident in regions experiencing rapid urbanization and changing dietary habits. Overall, the convenience factor not only sustains steady demand but also encourages market players to diversify their product offerings and packaging formats.
Product innovation and flavored varieties
Flavored tuna varieties are transforming the market landscape by appealing to younger demographics and expanding consumption occasions beyond traditional uses. The segment's robust 7.12% CAGR growth highlights the effectiveness of differentiation strategies that not only command premium pricing but also address consumer fatigue with plain tuna products. Companies like Thai Union are driving innovation by integrating sustainability into their operations, with 85% of their tuna sourced from MSC-certified fisheries. This approach demonstrates that innovation extends beyond flavor profiles to include ethical and responsible sourcing practices, which are increasingly valued by consumers. Additionally, the FDA's proposed amendments to canned tuna standards in August 2023, allowing the broader use of flavorings and spices, provide a regulatory framework that supports continued innovation. This flexibility empowers manufacturers to explore ethnic flavors and fusion concepts, catering to the evolving tastes of a diverse consumer base and further enhancing the segment's growth potential.
Sustainability and overfishing concerns
As consumer awareness of overfishing's impacts grows, the canned tuna industry grapples with the pressing challenge of environmental sustainability. The Western Central Pacific Ocean, responsible for about half of the global tuna catch, risks losing certification for its 33 MSC-certified tuna fisheries unless harvest control rules are established. In response to sustainability pressures, ICCAT introduced new measures for tropical tuna and management procedures for skipjack tuna in November 2024, yet challenges in implementation persist. Companies like Pacifical are leading the charge, employing Ethereum-based verification through blockchain systems to trace over 200 million consumer units each year. This heightened consumer awareness has led to a willingness to pay premiums for sustainable products, creating lucrative opportunities for certified brands while intensifying pressure on those that remain non-compliant.
Other drivers and restraints analyzed in the detailed report include:
- Expansion of e-commerce and online retail
- Technological advancements in processing and packaging
- Rise of plant-based canned-seafood alternatives
For complete list of drivers and restraints, kindly check the Table Of Contents.
Segment Analysis
In 2025, light tuna commands a dominant 59.59% market share, thanks to its cost-effectiveness and versatility. It's a staple, from basic meal prep to foodservice operations, where consistent and affordable protein sources are paramount. The segment's stability is bolstered by the healthy stock status of skipjack tuna, which constitutes 60% of the global tuna catch and enjoys effective management in key fishing regions. While yellowfin tuna adds diversity to light tuna products, it grapples with regional challenges in the Indian Ocean, unlike its more stable Pacific counterparts. The FDA's mercury monitoring programs ensure safety for light tuna products, which, due to the smaller size of skipjack compared to albacore species, typically boast lower mercury levels. This market dominance underscores a clear consumer preference: affordable protein options that seamlessly blend with various ingredients and seasonings.
White tuna is on a rapid ascent, boasting a 6.48% CAGR through 2031. This surge is attributed to savvy premium positioning strategies that play on consumer perceptions of its superior quality and taste over light tuna varieties. The price gap between white and light tuna presents processors with a lucrative margin expansion opportunity, especially in developed markets where consumers' disposable income leans towards higher-value purchases. Albacore tuna, the star of white tuna products, enjoys relatively stable stock conditions, ensuring a steady supply that bolsters its premium market stance. This growth trajectory signals a shift in consumer preferences, with health-conscious buyers ready to pay a premium for perceived quality. Furthermore, white tuna's premium status is amplified by its ties to traditional albacore fishing and artisanal processing methods, resonating with quality-centric consumers.
In 2025, unflavored tuna commands a dominant 85.69% market share, underscoring its adaptability in cooking and the tendency of budget-conscious consumers to opt for basic products that can be tailored to personal tastes at home. This segment's robust position is attributed to its wide-ranging use, from classic tuna salads to modern grain bowls and global culinary adaptations. Unflavored products enjoy reduced production costs and streamlined supply chain management, allowing for competitive pricing that resonates with both budget-minded consumers and bulk buyers in the foodservice sector. The FDA's proposed updates to canned tuna standards aim to uphold product integrity while granting manufacturers leeway in basic formulations. Unflavored tuna's market supremacy is further bolstered by its status as a pantry essential, delivering dependable protein without flavor limitations that could restrict its culinary applications.
Flavored tuna varieties are on a growth trajectory, boasting a 6.97% CAGR. This surge is fueled by effective product differentiation strategies that broaden consumption occasions and draw in younger consumers in search of convenient and flavorful meal options. The uptick in this segment mirrors a wider industry shift towards convenience and diverse flavors. Manufacturers are channeling investments into research and development, crafting products that resonate with varied taste preferences and global culinary trends. There's a notable emphasis on ethnic and fusion flavors, with companies tapping into global taste movements to produce unique offerings that fetch premium prices compared to traditional unflavored varieties. Additionally, the flavored segment's rise is amplified by social media campaigns that highlight innovative uses for seasoned tuna, boosting visibility among younger audiences who prioritize convenience and flavor diversity.
Geography Analysis
In 2025, Europe remains the leading market for canned tuna, holding a 35.40% market share. This dominance is primarily attributed to Spain's role as the region's processing powerhouse, accounting for 70% of Europe's canned tuna production. Spain's advanced processing capabilities and well-established distribution networks enable efficient access to broader European markets. Additionally, strong consumer acceptance in Southern Europe further reinforces the region's leadership. The market's growth is increasingly driven by the rising demand for premium products and a growing focus on sustainability in purchasing decisions. Germany, Italy, and France are key consumption markets, collectively importing canned tuna worth over USD 1.5 billion annually. Despite the trade disruptions caused by Brexit, the UK continues to exhibit strong consumption levels. The European market's emphasis on MSC certification provides a significant competitive advantage for sustainable brands, as environmentally conscious consumers are willing to pay a premium for certified products that align with their values.
The Middle East and Africa region is experiencing robust growth, with a projected CAGR of 6.58% through 2031. This growth is supported by rising disposable incomes, rapid urbanization, and an increasing shift toward Western dietary habits. The UAE leads the region in canned tuna consumption, significantly exceeding the global average. Saudi Arabia and Egypt are emerging as critical growth markets, driven by government-led initiatives focused on food security and aquaculture development. The region's young and expanding middle-class population further supports market expansion. However, economic instability and geopolitical tensions present periodic challenges. Import-dependent markets like the UAE benefit from low tariffs that facilitate inter-regional trade, although the region's limited local processing capacity remains a constraint on growth.
Asia-Pacific markets exhibit diverse growth trajectories, shaped by varying economic conditions and consumer preferences across the region. Japan's food processing industry faces significant challenges due to the weak yen, which has increased import costs. Despite a broader industry decline, the canned and bottled food segment remained stable at USD 1.24 billion in 2023, reflecting steady demand. Vietnam has emerged as the second-largest tuna supplier to the US market, although the implementation of new regulations under Decree No. 37/2024/ND-CP, which mandate minimum catch sizes, has created export challenges. The region's growth outlook remains optimistic, supported by the expansion of middle-class populations and increasing protein consumption. However, supply chain disruptions and evolving regulatory frameworks continue to introduce volatility, impacting the overall market dynamics.
- Thai Union Group PCL
- Dongwon Industries/StarKist
- Bumble Bee Foods
- Bolton Group
- Princes Ltd.
- Century Pacific Group, Inc.
- Nauterra (Group Calvo)
- Frinsa del Noroeste
- Ocean Brands
- Safe Catch Inc.
- American Tuna Inc.
- Albacora S.A.
- LDH (La Doria) Group
- Zhejiang Ocean Family Co., Ltd.
- Crown Prince, Inc.
- Orkla ASA(Hame)
- Dardanel Onentas GIda San. Inc.
- Frinsa del Noroeste S.A.
- Princes Ltd.
- Wild Planet Foods, Inc
Additional Benefits:
- The market estimate (ME) sheet in Excel format
- 3 months of analyst support
TABLE OF CONTENTS
1 INTRODUCTION
- 1.1 Study Assumptions and Market Definition
- 1.2 Scope of the Study
2 RESEARCH METHODOLOGY
3 EXECUTIVE SUMMARY
4 MARKET LANDSCAPE
- 4.1 Market Overview
- 4.2 Market Drivers
- 4.2.1 Convenience and ready-to-eat appeal
- 4.2.2 Product innovation and flavored varieties
- 4.2.3 Expansion of e-commerce and online retail
- 4.2.4 Technological advancements in processing and packaging
- 4.2.5 High protein and nutritional value
- 4.2.6 Long shelf life and pantry staple status
- 4.3 Market Restraints
- 4.3.1 Sustainability and overfishing concerns
- 4.3.2 Rise of plant-based canned-seafood alternatives
- 4.3.3 Supply chain and price volatility
- 4.3.4 Mercury-level concerns among pregnant and young consumers
- 4.4 Supply-Chain Analysis
- 4.5 Regulatory Landscape
- 4.6 Technological Outlook
- 4.7 Porter's Five Forces Analysis
- 4.7.1 Threat of New Entrants
- 4.7.2 Bargaining Power of Buyers
- 4.7.3 Bargaining Power of Suppliers
- 4.7.4 Threat of Substitutes
- 4.7.5 Intensity of Competitive Rivalry
5 MARKET SIZE AND GROWTH FORECASTS (VALUE)
- 5.1 By Product Type
- 5.1.1 White Tuna
- 5.1.2 Light Tuna
- 5.2 By Flavor
- 5.2.1 Flavored
- 5.2.2 Unflavored
- 5.3 By Packaging Type
- 5.3.1 Metal Cans
- 5.3.2 Pouches
- 5.3.3 Glass Jars
- 5.4 By Distribution Channel
- 5.4.1 On-trade
- 5.4.2 Off-trade
- 5.4.2.1 Supermarkets/Hypermarkets
- 5.4.2.2 Convenience Stores
- 5.4.2.3 Online Retail Stores
- 5.4.2.4 Specialty Stores
- 5.4.2.5 Others
- 5.5 By Geography
- 5.5.1 North America
- 5.5.1.1 United States
- 5.5.1.2 Canada
- 5.5.1.3 Mexico
- 5.5.1.4 Rest of North America
- 5.5.2 Europe
- 5.5.2.1 Germany
- 5.5.2.2 United Kingdom
- 5.5.2.3 Italy
- 5.5.2.4 France
- 5.5.2.5 Spain
- 5.5.2.6 Netherlands
- 5.5.2.7 Poland
- 5.5.2.8 Belgium
- 5.5.2.9 Sweden
- 5.5.2.10 Rest of Europe
- 5.5.3 Asia-Pacific
- 5.5.3.1 China
- 5.5.3.2 India
- 5.5.3.3 Japan
- 5.5.3.4 Australia
- 5.5.3.5 Indonesia
- 5.5.3.6 South Korea
- 5.5.3.7 Thailand
- 5.5.3.8 Singapore
- 5.5.3.9 Rest of Asia-Pacific
- 5.5.4 South America
- 5.5.4.1 Brazil
- 5.5.4.2 Argentina
- 5.5.4.3 Colombia
- 5.5.4.4 Chile
- 5.5.4.5 Peru
- 5.5.4.6 Rest of South America
- 5.5.5 Middle East and Africa
- 5.5.5.1 South Africa
- 5.5.5.2 Saudi Arabia
- 5.5.5.3 United Arab Emirates
- 5.5.5.4 Nigeria
- 5.5.5.5 Egypt
- 5.5.5.6 Morocco
- 5.5.5.7 Turkey
- 5.5.5.8 Rest of Middle East and Africa
- 5.5.1 North America
6 COMPETITIVE LANDSCAPE
- 6.1 Market Concentration
- 6.2 Strategic Moves
- 6.3 Market Share Analysis
- 6.4 Company Profiles (includes Global level Overview, Market level overview, Core Segments, Financials as available, Strategic Information, Market Rank/Share for key companies, Products and Services, and Recent Developments)
- 6.4.1 Thai Union Group PCL
- 6.4.2 Dongwon Industries/StarKist
- 6.4.3 Bumble Bee Foods
- 6.4.4 Bolton Group
- 6.4.5 Princes Ltd.
- 6.4.6 Century Pacific Group, Inc.
- 6.4.7 Nauterra (Group Calvo)
- 6.4.8 Frinsa del Noroeste
- 6.4.9 Ocean Brands
- 6.4.10 Safe Catch Inc.
- 6.4.11 American Tuna Inc.
- 6.4.12 Albacora S.A.
- 6.4.13 LDH (La Doria) Group
- 6.4.14 Zhejiang Ocean Family Co., Ltd.
- 6.4.15 Crown Prince, Inc.
- 6.4.16 Orkla ASA(Hame)
- 6.4.17 Dardanel Onentas GIda San. Inc.
- 6.4.18 Frinsa del Noroeste S.A.
- 6.4.19 Princes Ltd.
- 6.4.20 Wild Planet Foods, Inc
7 MARKET OPPORTUNITIES AND FUTURE OUTLOOK

