
PUBLISHER: Mordor Intelligence | PRODUCT CODE: 2061859

PUBLISHER: Mordor Intelligence | PRODUCT CODE: 2061859
Sugar Toppings - Market Share Analysis, Industry Trends & Statistics, Growth Forecasts (2026 - 2031)
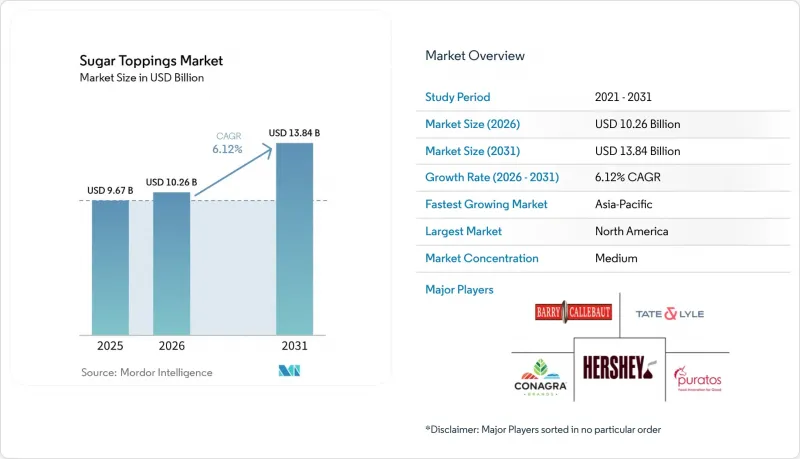
According to Mordor Intelligence, the sugar toppings market size was valued at USD 9.67 billion in 2025 and is estimated to grow from USD 10.26 billion in 2026 to reach USD 13.84 billion by 2031, at a CAGR of 6.12% during the forecast period (2026-2031).
This report is Segmented by Type (Sprinkles and Nonpareils, Syrups, Fondants and Icings, Whipped and Foam Toppings, Marshmallow and Meringue-Based, Others), Form (Dry, Liquid, Semi-solid/Paste), Application (Bakery Products, Ice-Cream and Frozen Desserts, Dairy, Beverages, and More), and Geography (North America, Europe, and More). The Market Forecasts are Provided in Terms of Value (USD) and Volume.
Global Sugar Toppings Market Trends and Insights
Growing Demand for Premium, Customized Desserts
Consumers are increasingly drawn to artisan finishes and exotic flavor profiles, driving a shift toward premiumization in sugar topping portfolios. In 2023, U.S. household spending on cakes and cupcakes rose by 26.4% year-on-year to USD 67, while candy expenditures increased by 31.2% to USD 164. These numbers highlight a growing willingness to spend on indulgent products despite inflation. This trend benefits high-margin specialty products like Monin's Yuzu Pineapple Syrup, introduced in March 2025 and sourced from the company's 74-acre biodynamic orchard in Portugal. Decorative toppings are also gaining traction, such as McCormick's Bridgerton-themed Finishing Sugars, launched in January 2026. According to Datassential, 86% of consumers expressed strong interest in yuzu-pineapple beverages, and 80% are eager for limited-time seasonal offerings, reinforcing the appeal of premium-tier products. Customization is also expanding to textures. Whipnotic's flavored swirled whipped cream, featuring patented nozzle technology, offers keto-friendly options with just 15 calories and 1 gram of sugar per serving, catering to health-conscious consumers seeking indulgence. Bakeries and dessert cafes are leveraging these premium toppings to stand out in competitive markets. This approach not only enhances their pricing power per unit but also helps offset declining volumes in mass-market segments.
Expansion of Cafe and Dessert Chain Culture
Starbucks reported a 4% growth in global comparable sales and a 5.5% increase in revenues, reaching USD 9.915 billion in the first quarter of fiscal 2026. These results reflect the growing demand for cafe toppings, particularly syrups and cold foam. The company plans to open 600 to 650 new stores in fiscal 2026, with each store requiring a steady supply of flavored syrups, whipped toppings, and drizzles for its signature beverages. Cold foam, projected by Datassential to grow 171% on menus over four years, has become a key area for flavor innovation. In July 2025, Rich Products launched "On Top Chocolate Soft Whip," a cold foam product free from high-fructose corn syrup and artificial colors, with a frozen shelf life of 365 days. Starbucks also reported a 7% increase in comparable sales in China, while local cafe chains in India, Indonesia, and Thailand are rapidly adopting Western-style topping menus. This expansion in the Asia-Pacific region creates more opportunities for syrup and topping suppliers but also increases competition, as regional players offer localized flavors at lower prices.
Rising Health Concerns Over High Sugar Consumption
The WHO recommends limiting free sugars to under 10% of daily energy intake, ideally below 5% (about 25 grams or 6 teaspoons). This puts pressure on sugar toppings, especially in developed markets where dental caries affect many of the 2.5 billion people with oral diseases. The WHO also discourages non-sugar sweeteners for weight control, narrowing reformulation options and challenging manufacturers to balance taste, texture, and health claims. For example, reducing sugar in whipped cream toppings from 10% to 9% while maintaining texture and shelf stability requires precise ingredient adjustments. In Northern Ireland, taste panels preferred reformulated versions 92% of the time when texture and aroma were preserved. Post-COVID, 66% of U.K. consumers sought reduced-sugar products, but 56% of home bakers enjoy making homemade food, and 47% value superior taste, showing health concerns compete with indulgence. Manufacturers now offer premium full-sugar toppings for special occasions and reduced-sugar options for daily use, though the latter often have lower margins due to higher ingredient costs.
Other drivers and restraints analyzed in the detailed report include:
- Growth of Home Baking and DIY Dessert Preparation
- Growing Consumption of Frozen Desserts
- Stringent Food Labeling and Sugar Reduction Regulations
For complete list of drivers and restraints, kindly check the Table Of Contents.
Segment Analysis
Whipped and foam toppings are projected to grow at a 7.12% CAGR from 2026 to 2031, driven by the increasing use of cold foam in coffee chains and demand for dairy-alternative options. Rich Products' On Top Chocolate Soft Whip, launched in July 2025, reflects this trend with its clean-label formulation, year-long frozen shelf life, and focus on HORECA operators. Datassential predicts a 171% rise in cold foam menu items over four years, led by chains like Starbucks that use foam for flavor and visual appeal. Milram's lactose-free whipped cream, with 9% added sugar and 32% fat, addresses dietary needs while maintaining professional quality. Whipnotic's flavored whipped cream, featuring patented nozzle technology and keto-friendly options with 15 calories and 1 gram of sugar per serving, highlights how innovation attracts new consumers. The shift to plant-based options, such as Rich Products' On Top Oat Milk Soft Whip, further expands the market by catering to lactose-intolerant and vegan consumers.
Syrups accounted for 38.31% of the market in 2025, driven by popular chocolate, caramel, and fruit flavors in retail and foodservice. Monin's Yuzu Pineapple Syrup, launched in March 2025, reflects premiumization, with 86% of consumers showing interest in yuzu-pineapple beverages. Monin's Toasted Coconut Syrup, the 2026 Flavor of the Year, targets cocktails, coffee, and culinary uses with its clean-label appeal and 24 grams of added sugar per 30-milliliter serving. Conagra's Mrs. Butterworth's x Dunkin' Glazed Donut Flavored Syrup, introduced in January 2024, showcases brand collaborations that boost visibility. Smucker's price increases for toppings and syrups in Q4 fiscal 2025 highlight strong brand loyalty and pricing power in a competitive market. Fondants, icings, marshmallow and meringue toppings, and sprinkles cater to niche uses like cake decoration and holiday baking, with demand peaking seasonally but remaining modest year-round.
Geography Analysis
In 2025, North America contributed 33.85% of global sugar toppings revenue, driven by high ice cream consumption (1.23 billion gallons produced) and strong retail channels featuring brands like Hershey's syrups and Smucker's fruit toppings. Hershey's fiscal 2025 net sales rose 4.4% to USD 11.693 billion, with its North America Confectionery segment achieving USD 2.478 billion in fourth-quarter sales, up 5.3%, due to strong pricing and brand equity. U.S. household spending on candy increased 31.2% year-on-year in 2023 to USD 164, while cookie spending grew 26.4% to USD 91, reflecting rising demand for complementary toppings. Starbucks reported 4% growth in North America comparable sales in early fiscal 2026 and plans to open 600-650 new stores, highlighting the region's importance. However, regulatory challenges are growing. The FDA's updated Nutrition Facts label, requiring added sugar disclosures, has increased R&D costs. Smucker's raised topping prices in late fiscal 2025 to address compliance and input cost inflation. Mexico and Canada contribute modestly, with Mexico benefiting from middle-class spending and Canada maintaining steady demand through its mature bakery and foodservice sectors.
Asia-Pacific is projected to grow at a 7.43% CAGR from 2026 to 2031, driven by rising middle-class spending in India and China, cafe expansion, and premium confectionery trends. India's confectionery market grew at a 10.3% CAGR from 2019 to 2023, with sugar confectionery reaching USD 1.45 billion in 2023 and expected to hit USD 1.9 billion by 2028, supported by urbanization and Western dessert trends. India's food retail market, valued at USD 869 billion in 2025, saw online grocery sales grow over 40% annually to USD 12 billion, creating opportunities for premium toppings. Starbucks reported 7% comparable sales growth in China in early fiscal 2026, while chains in Indonesia, Thailand, and Singapore are adopting flavored syrups and cold foam to attract customers. Japan's sugar confectionery market is recovering at a 5.8% CAGR from 2023 to 2027, reaching USD 4.77 billion, after a decline from 2018 to 2022. Rising sugar costs have led to price increases, offsetting volume declines, but growing health awareness poses challenges, with some Indian states considering sugar taxes. White sugar remains a key ingredient in new products, presenting both opportunities and risks. Australia, South Korea, and smaller Southeast Asian markets contribute incrementally, with Australia's mature retail sector driving demand for icings and sprinkles, and South Korea's cafe culture boosting syrup consumption.
Europe's sugar toppings market benefits from strong bakery traditions and strict quality standards but faces rising regulatory pressures. EU regulations mandate detailed nutritional labeling, while the 2025/2058 sweetener regulation limits non-sugar alternatives, increasing compliance costs. Barry Callebaut reported a 26.8% drop in European sugar prices in fiscal 2024/25, easing costs for syrup and fondant producers, though cocoa prices surged 160% in 2024, squeezing chocolate topping margins. Germany, the U.K., France, Italy, and Spain are key markets. Germany's bakery sector and the U.K.'s home baking resurgence drive demand, with Waitrose reporting a 22% rise in home baking sales during Christmas 2025. While sweet baking occasions in the U.K. fell 25% in 2025 after a 22% surge in 2023, chocolate cake occasions remained 63% above 2022 levels. The Netherlands, Poland, Belgium, and Sweden contribute steadily, with the Netherlands' foodservice sector and Poland's growing cafe culture supporting demand. South America and the Middle East & Africa remain smaller markets. Brazil's dessert culture and the UAE's luxury hospitality sector offer niche opportunities, though infrastructure gaps and price sensitivity limit broader growth.
- The Hershey Company
- Barry Callebaut AG
- Conagra Brands, Inc.
- Puratos Group
- Tate & Lyle PLC
- ASR Group (Domino Foods)
- Nestle S.A.
- General Mills Inc.
- The J.M. Smucker Company
- Baldwin Richardson Foods Co.
- R. Torre & Company (Torani)
- Monin SAS
- Rich Products Corporation
- Wilton Brands LLC
- CK Products LLC
- Signature Brands LLC
- Lotus Bakeries NV
- Dr. Oetker GmbH
- Royal FrieslandCampina N.V.
- Pecan Deluxe Candy Co.
Additional Benefits:
- The market estimate (ME) sheet in Excel format
- 3 months of analyst support
TABLE OF CONTENTS
1 INTRODUCTION
- 1.1 Study Assumptions and Market Definition
- 1.2 Scope of the Study
2 RESEARCH METHODOLOGY
3 EXECUTIVE SUMMARY
4 MARKET LANDSCAPE
- 4.1 Market Overview
- 4.2 Market Drivers
- 4.2.1 Growing demand for premium, customized desserts
- 4.2.2 Expansion of cafe and dessert chain culture
- 4.2.3 Growth of home baking and DIY dessert preparation
- 4.2.4 Growing consumption of frozen desserts
- 4.2.5 Demand for customized food experiences
- 4.2.6 Rising demand for seasonal and limited-edition products
- 4.3 Market Restraints
- 4.3.1 Rising health concerns over high sugar consumption
- 4.3.2 Stringent food labeling and sugar reduction regulations
- 4.3.3 Volatility in raw material prices
- 4.3.4 Competition from non-sugar toppings
- 4.4 Technological Outlook
- 4.5 Regulatory Landscape
- 4.6 Supply-Chain Analysis
- 4.7 Porter's Five Forces Analysis
- 4.7.1 Threat of New Entrants
- 4.7.2 Bargaining Power of Buyers
- 4.7.3 Bargaining Power of Suppliers
- 4.7.4 Threat of Substitutes
- 4.7.5 Intensity of Competitive Rivalry
5 MARKET SIZE AND GROWTH FORECASTS (VALUE AND VOLUME)
- 5.1 By Type
- 5.1.1 Sprinkles and Nonpareils
- 5.1.2 Syrups (Chocolate, Caramel, Fruit, etc.)
- 5.1.3 Fondants and Icings
- 5.1.4 Whipped and Foam Toppings
- 5.1.5 Marshmallow and Meringue-based
- 5.1.6 Others
- 5.2 By Form
- 5.2.1 Dry
- 5.2.2 Liquid
- 5.2.3 Semi-solid/Paste
- 5.3 By Application
- 5.3.1 Bakery Products
- 5.3.2 Ice-cream and Frozen Desserts
- 5.3.3 Dairy (Milkshakes, Yogurt, etc.)
- 5.3.4 Beverages (Coffee, Specialty Drinks)
- 5.3.5 Confectionery
- 5.3.6 Foodservice/HORECA
- 5.4 By Geography
- 5.4.1 North America
- 5.4.1.1 United States
- 5.4.1.2 Canada
- 5.4.1.3 Mexico
- 5.4.1.4 Rest of North America
- 5.4.2 Europe
- 5.4.2.1 Germany
- 5.4.2.2 United Kingdom
- 5.4.2.3 Italy
- 5.4.2.4 France
- 5.4.2.5 Spain
- 5.4.2.6 Netherlands
- 5.4.2.7 Poland
- 5.4.2.8 Belgium
- 5.4.2.9 Sweden
- 5.4.2.10 Rest of Europe
- 5.4.3 Asia-Pacific
- 5.4.3.1 China
- 5.4.3.2 India
- 5.4.3.3 Japan
- 5.4.3.4 Australia
- 5.4.3.5 Indonesia
- 5.4.3.6 South Korea
- 5.4.3.7 Thailand
- 5.4.3.8 Singapore
- 5.4.3.9 Rest of Asia-Pacific
- 5.4.4 South America
- 5.4.4.1 Brazil
- 5.4.4.2 Argentina
- 5.4.4.3 Colombia
- 5.4.4.4 Chile
- 5.4.4.5 Peru
- 5.4.4.6 Rest of South America
- 5.4.5 Middle East and Africa
- 5.4.5.1 South Africa
- 5.4.5.2 Saudi Arabia
- 5.4.5.3 United Arab Emirates
- 5.4.5.4 Nigeria
- 5.4.5.5 Egypt
- 5.4.5.6 Morocco
- 5.4.5.7 Turkey
- 5.4.5.8 Rest of Middle East and Africa
- 5.4.1 North America
6 COMPETITIVE LANDSCAPE
- 6.1 Market Concentration
- 6.2 Strategic Moves
- 6.3 Market Positioning Analysis
- 6.4 Company Profiles (includes Global level Overview, Market level overview, Core Segments, Financials as available, Strategic Information, Market Rank/Share for key companies, Products and Services, and Recent Developments)
- 6.4.1 The Hershey Company
- 6.4.2 Barry Callebaut AG
- 6.4.3 Conagra Brands, Inc.
- 6.4.4 Puratos Group
- 6.4.5 Tate & Lyle PLC
- 6.4.6 ASR Group (Domino Foods)
- 6.4.7 Nestle S.A.
- 6.4.8 General Mills Inc.
- 6.4.9 The J.M. Smucker Company
- 6.4.10 Baldwin Richardson Foods Co.
- 6.4.11 R. Torre & Company (Torani)
- 6.4.12 Monin SAS
- 6.4.13 Rich Products Corporation
- 6.4.14 Wilton Brands LLC
- 6.4.15 CK Products LLC
- 6.4.16 Signature Brands LLC
- 6.4.17 Lotus Bakeries NV
- 6.4.18 Dr. Oetker GmbH
- 6.4.19 Royal FrieslandCampina N.V.
- 6.4.20 Pecan Deluxe Candy Co.
7 MARKET OPPORTUNITIES AND FUTURE OUTLOOK

