
PUBLISHER: Mordor Intelligence | PRODUCT CODE: 2061993

PUBLISHER: Mordor Intelligence | PRODUCT CODE: 2061993
Agentic AI In Retail And ECommerce - Market Share Analysis, Industry Trends & Statistics, Growth Forecasts (2026 - 2031)
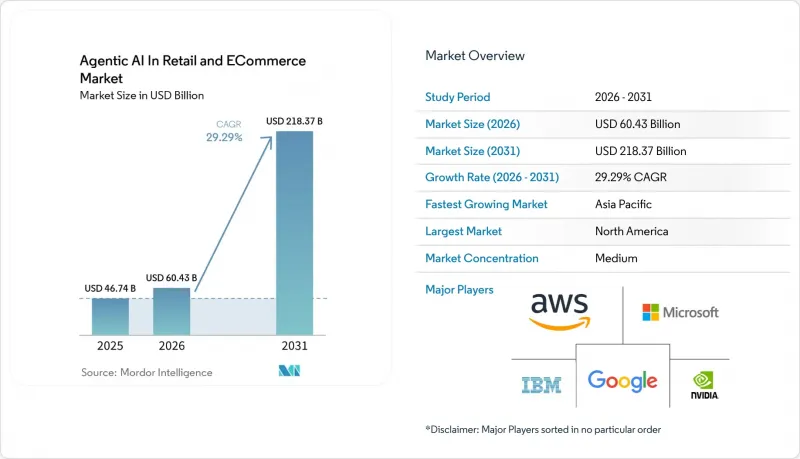
According to Mordor Intelligence, the agentic AI in retail and eCommerce market size in 2026 is estimated at USD 60.43 billion, growing from 2025 value of USD 46.74 billion with 2031 projections showing USD 218.37 billion, growing at 29.29% CAGR over 2026-2031.
This report is Segmented by Application (Customer Engagement & Marketing Agents, Supply-Chain & Logistics Agents, and More), Retail Format (E-Commerce Pure-Plays, Omnichannel Retailers, and More), Technology Approach Deployment Model (Cloud, On-Premises, and More), Organization Size, and Geography. The Market Forecasts are Provided in Terms of Value (USD).
Global Agentic AI In Retail And ECommerce Market Trends and Insights
Generative-AI Cost-to-Serve Reduction Imperatives
Retailers face unrelenting cost pressure and thin margins, prompting swift adoption of autonomous agents that trim labour hours while preserving service quality. Walmart's AI-driven waste dashboards forecast spoilage and guide associates to pre-empt losses, whereas Target's 2,000-store rollout of Store Companion chatbots accelerates onboarding by giving employees instant procedural answers. The shift from scripted bots to reasoning agents eliminates tier-1 support queues and reduces average handling time, improving satisfaction scores. Analysts at EY India project a 35-37% productivity lift for the country's retail sector within five years from generative AI alone. Early adopters spread fixed GPU costs across millions of interactions, reinforcing economies of scale not available to late entrants.
Hyper-Personalized CX Race Among Tier-1 Retailers
Retail leaders weaponize agentic AI to tailor every interaction. Victoria's Secret relies on Google Cloud large-language agents for real-time product suggestions, integrating sentiment analytics with inventory data to surface relevant SKUs instantly. Amazon's internal count of 1,000 generative AI shopping applications shows the magnitude of personalization bets, all accelerated by custom Trainium 2 silicon that lowers inference cost. Google Cloud cites a home-improvement chain adding USD 16 million of incremental revenue from visual-search agents alone. As recommendations grow context-aware, consumers develop loyalty to platforms that "know" them, raising competitive barriers.
Governance Debt and Hallucination Risk
Retailers push AI faster than governance frameworks mature. IKEA's early EU AI Act alignment demonstrates best practice, yet many peers lack similar rigor. Harvard Business School found 84% of AI-generated shift rosters required manual overrides due to bad inputs, eroding trust. Customer-facing hallucinations risk defamation or regulatory fines; Deloitte stresses multi-disciplinary centers of excellence, but many retailers still lack system-level validation.
Other drivers and restraints analyzed in the detailed report include:
- Autonomous Supply-Chain Control-Towers
- AI-Talent Retention/Attrition Arms-Race
- GPU-Cluster Power-Supply Bottlenecks
For complete list of drivers and restraints, kindly check the Table Of Contents.
Segment Analysis
Customer Engagement and Marketing Agents held 37.45% of the agentic AI in retail and eCommerce market share in 2025, reflecting retailers' focus on revenue-generating touchpoints. Demand for conversational agents that handle product discovery, upsell, and service resolutions keeps overall application spend elevated. The agentic AI in retail and eCommerce market size tied to Customer Engagement is forecast to rise in tandem with loyalty-program overhauls, embedding real-time offer engines that refine decisions every interaction.
Fraud and Risk Management, though smaller today, posts a 34.12% CAGR to 2031, underscoring loss-prevention urgency. Veesion's gesture-recognition algorithm, live in 5,000 stores, alerts security within seconds and shows 85% relevance, proving ROI. Retailers integrate CCTV-native models such as Mazaal's Retail Guardian to curb self-checkout shrink. As regulations mandate stricter fraud reporting, adoption spreads to mid-tier chains.
Omnichannel Retailers captured 41.02% share of the agentic AI in retail and eCommerce market in 2025, leveraging unified data lakes that span web, app, and store. Agents synchronize inventory views, price parity, and fulfilment promises, sustaining competitive parity with pure-play e-commerce rivals.
Grocery and Convenience accelerates at a 32.86% CAGR, making it the fastest-growing format. High-velocity SKU turns, perishability, and labour intensity create fertile ground for autonomous agents. Lawson's Real x Tech lab in Tokyo combines AI cameras and virtual cashiers for touchless journeys, while 7-Eleven's AI-Clerk unmanned stores in Seoul demonstrate feasibility in high-footfall environments. Dynamic pricing engines such as Puzl AI let grocers balance margin and waste, nudging market-wide adoption.
Geography Analysis
North America accounted for 37.35% of the agentic AI in retail and eCommerce market in 2025, supported by dense cloud regions, venture capital access, and leading retailers that operate as living labs for autonomous systems. Amazon's 1,000-application generative AI roadmap and custom silicon demonstrate entrenched commitment. Walmart and Target validate use cases at multi-billion-dollar scale, attracting vendor ecosystems that cluster around Bentonville and Seattle. Regulation remains favourable, but GPU and datacentre-power shortages lengthen project queues.
Asia-Pacific posts the fastest 34.88% CAGR to 2031. SoftBank aims for 1 billion AI agents by 2026, signalling bold investment attitudes. China's AI avatars outperform human live streamers, generating USD 7 million in seven hours, underscoring consumer openness to agentic commerce. India sees 48% of retailers piloting generative AI, backed by government skilling funds, pushing diffusion beyond metro centers. Diverse languages and payment ecosystems favour agents that localize seamlessly.
Europe emphasizes responsible AI, balancing innovation with consumer protection. IKEA's governance blueprint guides peers through EU AI Act compliance. Labor-scarce UK grocers introduce AI shelf labels and cameras to offset wage inflation. Vendor opportunity lies in out-of-the-box compliance toolkits that embed transparency reports and algorithm audit trails.
- Amazon Web Services Inc.
- Microsoft Corporation (Azure AI)
- Google LLC (Vertex AI)
- International Business Machines Corporation
- NVIDIA Corporation
- Salesforce Inc.
- SAP SE
- Oracle Corporation
- Alibaba Cloud Computing Co. Ltd.
- Snowflake Inc.
- Databricks Inc.
- SymphonyAI LLC
- Algonomy Software Pvt Ltd.
- RetailNext Inc.
- Honeywell International Inc.
- Accenture plc
- PwC International Ltd.
- KPMG International Ltd.
- Capgemini SE
- Cognizant Technology Solutions Corp.
Additional Benefits:
- The market estimate (ME) sheet in Excel format
- 3 months of analyst support
TABLE OF CONTENTS
1 INTRODUCTION
- 1.1 Study Assumptions and Market Definition
- 1.2 Scope of the Study
2 RESEARCH METHODOLOGY
3 EXECUTIVE SUMMARY
4 MARKET LANDSCAPE
- 4.1 Market Overview
- 4.2 Market Drivers
- 4.2.1 Generative-AI cost-to-serve reduction imperatives
- 4.2.2 Hyper-personalised CX race among Tier-1 retailers
- 4.2.3 Autonomous supply-chain control-towers
- 4.2.4 AI-talent retention/attrition arms-race
- 4.2.5 ESG-linked shrinkage and waste mandates
- 4.2.6 Synthetic data for low-margin SKU expansion
- 4.3 Market Restraints
- 4.3.1 Governance debt and hallucination risk
- 4.3.2 GPU-cluster power-supply bottlenecks
- 4.3.3 Workforce resistance to agentic co-workers
- 4.3.4 Rising synthetic-content fraud
- 4.4 Value / Supply-Chain Analysis
- 4.5 Regulatory Landscape
- 4.6 Technological Outlook
- 4.7 Porter's Five Forces
- 4.7.1 Threat of New Entrants
- 4.7.2 Bargaining Power of Suppliers
- 4.7.3 Bargaining Power of Buyers
- 4.7.4 Threat of Substitutes
- 4.7.5 Competitive Rivalry
5 MARKET SIZE AND GROWTH FORECASTS (VALUE)
- 5.1 By Application
- 5.1.1 Customer Engagement and Marketing Agents
- 5.1.2 Supply-Chain and Logistics Agents
- 5.1.3 In-Store Ops and Loss-Prevention Agents
- 5.1.4 Merchandising and Dynamic-Pricing Agents
- 5.2 By Retail Format
- 5.2.1 E-Commerce Pure-Plays
- 5.2.2 Omnichannel Retailers
- 5.2.3 Grocery and Convenience
- 5.2.4 Specialty Stores
- 5.3 By Technology Approach
- 5.3.1 Generative Dialogue Agents
- 5.3.2 Prescriptive Analytics Agents
- 5.3.3 Computer-Vision Agents
- 5.3.4 Voice-Commerce Agents
- 5.4 By Deployment Model
- 5.4.1 Cloud
- 5.4.2 On-Premises
- 5.4.3 Edge
- 5.5 By Organization Size
- 5.5.1 Large Enterprises
- 5.5.2 Small and Mid-Sized Enterprises
- 5.6 By Geography
- 5.6.1 North America
- 5.6.1.1 United States
- 5.6.1.2 Canada
- 5.6.1.3 Mexico
- 5.6.2 Europe
- 5.6.2.1 United Kingdom
- 5.6.2.2 Germany
- 5.6.2.3 France
- 5.6.2.4 Italy
- 5.6.2.5 Rest of Europe
- 5.6.3 Asia-Pacific
- 5.6.3.1 China
- 5.6.3.2 Japan
- 5.6.3.3 India
- 5.6.3.4 South Korea
- 5.6.3.5 Rest of Asia-Pacific
- 5.6.4 Middle East
- 5.6.4.1 Israel
- 5.6.4.2 Saudi Arabia
- 5.6.4.3 United Arab Emirates
- 5.6.4.4 Turkey
- 5.6.4.5 Rest of Middle East
- 5.6.5 Africa
- 5.6.5.1 South Africa
- 5.6.5.2 Egypt
- 5.6.5.3 Rest of Africa
- 5.6.6 South America
- 5.6.6.1 Brazil
- 5.6.6.2 Argentina
- 5.6.6.3 Rest of South America
- 5.6.1 North America
6 COMPETITIVE LANDSCAPE
- 6.1 Market Concentration
- 6.2 Strategic Moves
- 6.3 Market Share Analysis
- 6.4 Company Profiles (includes Global level Overview, Market level overview, Core Segments, Financials as available, Strategic Information, Market Rank/Share for key companies, Products and Services, and Recent Developments)
- 6.4.1 Amazon Web Services Inc.
- 6.4.2 Microsoft Corporation (Azure AI)
- 6.4.3 Google LLC (Vertex AI)
- 6.4.4 International Business Machines Corporation
- 6.4.5 NVIDIA Corporation
- 6.4.6 Salesforce Inc.
- 6.4.7 SAP SE
- 6.4.8 Oracle Corporation
- 6.4.9 Alibaba Cloud Computing Co. Ltd.
- 6.4.10 Snowflake Inc.
- 6.4.11 Databricks Inc.
- 6.4.12 SymphonyAI LLC
- 6.4.13 Algonomy Software Pvt Ltd.
- 6.4.14 RetailNext Inc.
- 6.4.15 Honeywell International Inc.
- 6.4.16 Accenture plc
- 6.4.17 PwC International Ltd.
- 6.4.18 KPMG International Ltd.
- 6.4.19 Capgemini SE
- 6.4.20 Cognizant Technology Solutions Corp.
7 MARKET OPPORTUNITIES AND FUTURE OUTLOOK
- 7.1 White-space and Unmet-Need Assessment

